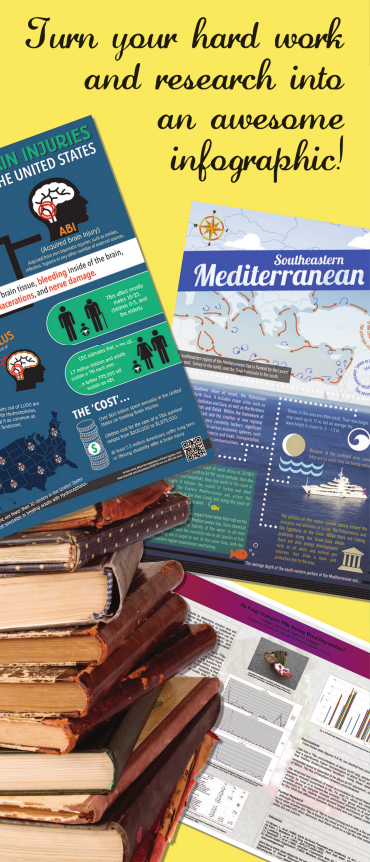
You’ve worked really hard on your research. You’ve spent days collecting samples, weeks processing and analyzing the samples. You’ve double and triple checked the statistical accuracy, made sure your paper was written up nice and tidy.
Then, you get an email reminding you of that academic conference you signed up for. You want to make an impression with your work to further your career, and this is the ticket in and up the ranks. As the excitement builds, so does the realization that you have classes to go to, homework to do, more work in the lab, and papers to grade. Let’s not mention the mountain of things to do back home, plus the prepping for the conference.
Let us help you succeed.
We’re your secret weapon. We can help you turn your hard work into a beautiful infographic style poster while you rush around making sure your life is in order. While you’re in class or tidying up, we’ll be hard at work highlighting the key points of your research and turning it into a head-turning piece of art that will make you look good at the conference.

How it works
The key is to build an eye catching poster that makes people look, read, and ask questions. We’re all experienced academics here, so we know engagement is the key. Not only does it make meetings more fun and productive, but it also means your research get the recognition you want it to have.
To achieve this, we build a small team of one science writer with a specialisation in your area of research and one graphic designer that really gets your personality (and knows science).
The process?
First, you’ll work with the science writer to highlight the key points in your research you want to highlight. This should only take one short meeting, then the science writer takes a copy of your research and these notes to create a short, eye-catching summaries of these parts.
Then, the graphic designer gets their turn to show, not tell, your audience the who, what, where, when, how, and so what of your research ─ all highlighted with the text the science writer. Think pop up boxes above a graph telling the reader what important thing they are looking at, for example.
The results?
You get a digital PDF that you can do whatever you like with, a printed copy we ship to your lab (or conference if you’re cutting it close), and your research is proudly broadcast across social media in the form of a mini-infographic to show the public what cool things are afoot in your field.
Why settle for boring when you can make your poster the talk of the conference?
What our clients are saying:
This poster is amazing. All the details are great! – Ali Alarafat, Southeastern Mediterranean
You guys have done a great job teaching about the cost of brain injuries. – Norman Shaifer, Cost of Brain Injuries