Everyone already teaches the water cycle. Most textbooks and museum exhibits stop neatly at evaporation–condensation–precipitation—a tidy loop that explains where rain comes from, but not why some places stay dry while others are drenched year‑round.
At Insanitek, we like to go one step further. The same ideas that drive the water cycle—energy from the Sun, changing temperatures, and shifting moisture—also build the world’s climates and biomes. Connecting those dots helps students see how short‑term weather adds up to long‑term environmental patterns.
Weather vs. Climate in Plain Language
In the simplest terms:
- Weather is what’s happening in the atmosphere right now or over a few days.
- Climate is the typical pattern of temperature and precipitation in a particular region over many years.
This difference matters because climate sets the stage for ecosystems. The daily weather may vary wildly, but the long‑term averages determine what can live and grow there.
Biomes as “Climate Fingerprints”
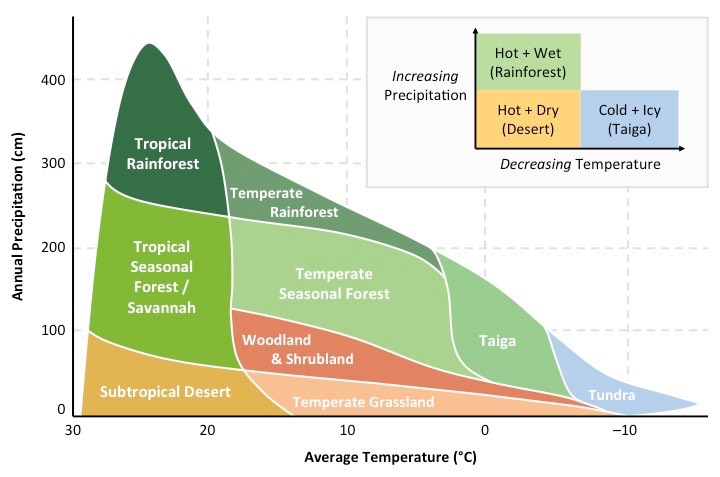
A biome is a large region defined by its typical climate and the plants and animals adapted to it. If we graphed average temperature on one axis and precipitation on the other, each biome would cluster in its own distinctive zone—its climate fingerprint.
For example, tropical rainforests sit high on the precipitation axis and fairly high on temperature. Deserts, by contrast, stay low on rainfall and can range from cool to scorching. Grasslands hover in the middle of both. These patterns make it easy for students to “see” the link between temperature, moisture, and life.
The Tundra vs. Desert Example
Tundra and desert both qualify as dry, yet they feel completely different. On a temperature‑precipitation graph, they both lie low on the rainfall axis, but tundra points cluster at very low temperatures while deserts sit far to the right—hotter on average.
Add a rainforest and a grassland to that same graph, and the differences become even clearer. Rainforests plot high in precipitation and temperature, while grasslands sit mid‑range on both scales. The picture that emerges tells the story of how climate shapes biomes—no words needed.
Seeing Climate vs. Weather Through Biomes
Plotting biomes also clears up one of the most common classroom misconceptions: a single weather event doesn’t change the climate. If it snows in a warm city once, the dot on our biome graph doesn’t shift. Climate is about patterns over decades, not one odd storm.
When students grasp that, they stop mixing up “today’s forecast” with “typical conditions,” and start thinking like scientists—looking for long‑term trends backed by data.
Idea Sparks for Teachers
These quick ideas build that understanding with minimal prep:
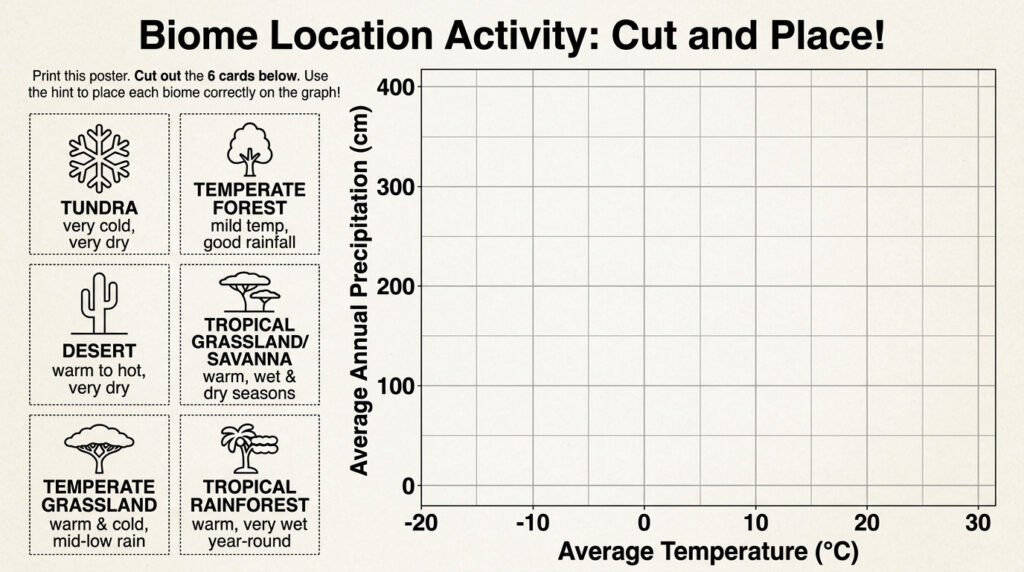
- Biome sorting game: Have students match biome cards to positions on a large temperature‑precipitation graph on your board or floor.
- Guess the biome: Give average annual temperature and rainfall numbers; let students decide which biome fits.
- Compare climates: Plot your local region on the graph, then contrast it with a tundra or tropical zone.
- Think aloud: Ask students why one unusually hot or cold day doesn’t move your dot on the graph.
Each activity keeps the focus on reasoning from patterns, not memorizing terms.
Classroom Resources You Can Use Today
If you want ready‑to‑use graphs, maps, and activities, these are solid, non‑political starting points:
- NOAA Climate.gov – Teaching Climate: A large collection of vetted classroom activities and data tools on weather, climate, and energy for grades 6–12, with some adaptable to upper elementary.
- NASA “Mission: Biomes”: Interactive biome explorations, climate graphs for representative cities, and hands‑on activities specifically designed for grades 3–8.
- UCAR “Climate Postcards” and biomes resources: Middle‑school‑friendly activities where students interpret climate graphs, connect climate zones to biomes, and reason from graphed data.
- EPA Climate Change Resources for Educators and Students: A curated hub that links out to NOAA climate education, NASA Climate Kids, and other federal resources, so you can stay with reputable sources.
You can easily pair these with your existing water‑cycle lessons to build a stronger climate vs. weather unit for upper elementary and middle school.
Linking to Bigger Environmental Thinking
Once students can visualize biomes on a graph, it’s natural to introduce how climates shift over time. You can frame climate change not as a debate, but as moving those biome “dots” along the axes—some creeping toward warmer or drier zones, others to cooler or wetter ones.
That data‑driven view lays the groundwork for later projects exploring local environmental change, long‑term weather data, or ecosystem shifts.
Teaching the water cycle is important—but expanding it into climate and biomes gives students a richer, systems‑level view of Earth science. It turns a memorized diagram into a tool for understanding the living world around them.