Visual mathematics, the practice of representing mathematical concepts through diagrams, drawings, or models, has played an important—though often debated—role in how humans have understood and advanced mathematics throughout history.
Ancient and Classical Origins
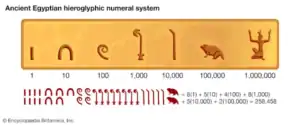
Some of the earliest traces of visual mathematics are not what you think they are. Maps, geometric diagrams, and other visual artefacts have existed since the earliest societies. Ancient stone tablets and papyrus often contained pictorial representations of calculations, land measurements, or astronomical phenomena. All of these are considered visual – or applied – math . The question might be where does math start becoming more about passing knowledge, less about business. That’s the Greeks.
Romans had the abacus and kept to the practical nature of math. The Ancient Greek mathematicians, however, took more of a philosophical and theoretical approach. Euclid, a noted early mathematician, used visual diagrams extensively in geometry. His Elements relied on drawn constructions to communicate proofs and concepts. Visual thinking also emerged through his work on optics and perspective The Medieval and Renaissance Periods . Archimedes and Pythagoras were contemporaries of Euclid, each contributing their own rigorous methods to the foundation.
Mathematicians and scientists like Alhazen (Ibn al-Haytham) expanded knowledge of optics, vision, and geometrical constructions, blending mathematical theory with direct visual observation and reasoning, taking it to the next level . This built a step up to the Renaissance Art and Geometry era. Artists like Brunelleschi and Alberti pioneered linear perspective using geometric principles, integrating mathematics into art. Visual geometry became foundational in the works of Renaissance painters and architects seeking to model three-dimensional space accurately .

Early Modern Developments
René Descartes’ invention of coordinate geometry in the 17th century marked a turning point, allowing algebraic equations to be visually represented as curves and shapes on a plane . This was still a fairly visual method of understanding and illustrating math. If you’ve never read a historical math treatise book, it really is like a science paper that spends a lot of time exploring and defending the hows and whys things work. Descartes’ book is full of diagrams and visuals known as proofs. The methods we use now can be thought of as the shorthand answers after he put in the work.
Anyone that has seen a graph or chart has seen the work of William Playfair. In the 18th and 19th centuries, Playfair developed bar and line graphs, pie charts, and other graphical methods to present statistical data visually . This field has even advanced to making beautiful visuals that can really elucidate points and highlight parts of stories that the storyteller wants you to pay attention to.
The Rise of Formalism
This discussion on the history of visualisation in mathematics is amusing as the answer is quite in depth for as the author starts stating that not much has been written about the topic. In the answer, we learn that as mathematics became increasingly formalized, figures such as Bernard Bolzano and Karl Weierstrass championed more analytical and less visual approaches, particularly in analysis and topology .
Of course, propaganda plays a part in academics. Visual intuition became viewed by some as potentially misleading or insufficiently rigorous for logical proofs. This set off the course through the 19th and 20th centuries full of heated debates on the legitimacy of diagrams and visual reasoning. Mathematicians like Hilbert and Pasch argued that true proofs must be entirely independent of figures, emphasizing abstract thought over intuition .
20th Century to the Present
The “New Math” movements of the 1960s and 1970s education methods often minimized the use of visual aids in favor of streamlined abstract structures. However, as Dr. Barrow pointed out in this lecture , visualization never disappeared entirely, especially in teaching geometry, statistics, and calculus. Of course, it’s not just in the classes where we use visual mathematics.
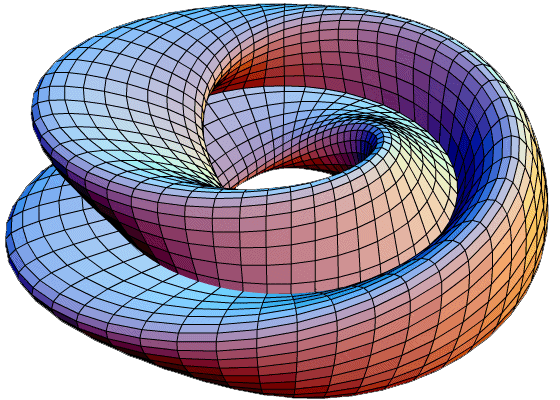
Advances in computing have transformed visual mathematics. Dynamic graphics, animations, 3D modeling, and computer-generated imagery allow for the exploration and presentation of highly complex mathematical ideas. This has influenced research, education, and artistic collaborations, giving rise to a new “visual mathematics” in the digital age . We now use data information charts on the daily in many industries to visualise information we need for our work.
Visual proofs—such as geometric demonstrations of the Pythagorean theorem—have existed for millennia and continue to be powerful tools for understanding and communicating mathematics.

Strengths and Weaknesses of a Visual Math Method
Strengths
-
Deepens Conceptual Understanding
Visual math methods help bridge the gap between abstract mathematical ideas and practical applications. By seeing concepts visually, students can grasp how different ideas are interconnected, which promotes deeper comprehension and retention . -
Improves Problem-Solving and Critical Thinking
Techniques such as diagrams, graphs, and models encourage students to break down complex problems into manageable components, supporting analytical reasoning and creative approaches to mathematical challenges . -
Engages and Motivates Learners
Visual representations—like graphs, models, and digital simulations—can make learning math more interactive and enjoyable, leading to increased student engagement and participation . -
Assists Diverse Learning Needs
Visual strategies can be particularly beneficial for students who struggle with traditional symbolic math, including those with math anxiety or learning differences, by providing alternative entry points to understanding . -
Supports Memory and Recall
Presenting information visually aids long-term retention, as images and spatial relationships are often more memorable than abstract symbols alone . -
Applicable Across Grade Levels
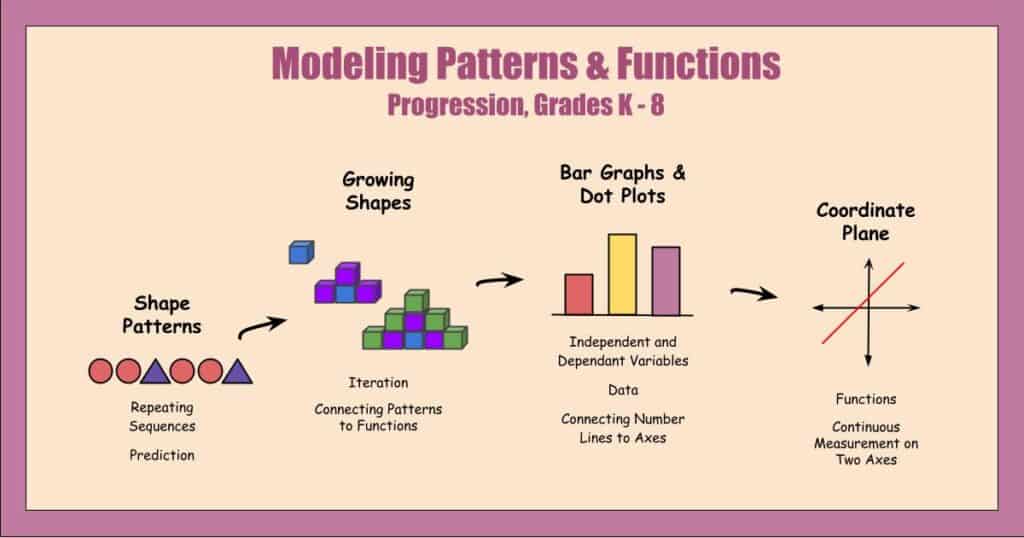
Visual methods, including number lines, geometric models, and schema diagrams, can be adapted to suit a wide variety of mathematical topics and student ages, from early arithmetic to advanced concepts .
Weaknesses
-
Potential for Inaccurate Visuals
If students construct inaccurate or misleading visual representations, they are less likely to solve problems correctly than those who do not use visuals at all. The effectiveness of visual strategies depends on the accuracy and appropriateness of the representations . -
Not a Standalone Solution
Over-reliance on visual methods may hinder the development of symbolic or abstract reasoning skills required for advanced mathematics or standardized assessments . -
Individual Differences in Visual Ability
Students vary widely in their visual-spatial skills. Those with weaker visual abilities may find it difficult to construct or interpret diagrams, which can lead to confusion or misconceptions . -
Risk of Surface Learning
Some students may focus on the appearance of visuals rather than the underlying mathematical relationships, leading to “surface-level” understanding without genuine comprehension . -
Limited for Certain Concepts
Not all mathematical topics lend themselves equally to visual representation—some, like abstract algebra or symbolic manipulations, may be less accessible visually and require traditional symbolic approaches . - Check out all our Done For You visual math resources in the store! All downloadable resources are Pay What You Want Pricing to make it more accessible for you.
