
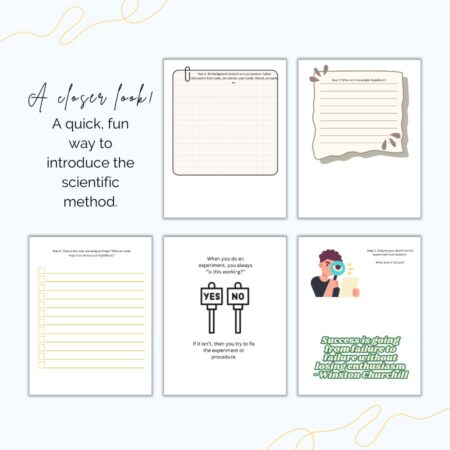
Earth keeps a diary, but it does not use words—it writes in layers. Each bed of sand, mud, ash, or gravel preserves a brief episode in Earth’s history: a river shifting course, a shoreline advancing or retreating, an eruption dusting the landscape, or a long pause marked only by weathering and erosion. Stratigraphy is the discipline that teaches how to read that diary, turning vertical stacks and lateral patterns of layers into a relative timeline of events across local outcrops and entire regions. For educators and self‑teaching adults, stratigraphy is not just vocabulary; it functions as a reasoning toolkit that can be modeled through simple activities and then transferred to real landscapes.
What stratigraphy is (in the professional sense)
In professional geology, stratigraphy is the study and systematic description of layered rocks and sediments and their organization into recognizable, mappable units that can be correlated in space and sequenced in time. Stratigraphers are interested both in the physical attributes of strata (lithology, thickness, internal structures, geometry) and in the relationships among units—how they stack, lap onto each other, or are truncated by later features .
This work is formalized in international and regional stratigraphic codes, which define how stratigraphic units are named, ranked (formation, member, group, etc.), and tied to reference sections. Introducing older students to the idea that there are global standards for “how to define a formation” emphasizes that reading layers is a rigorous, codified practice, not just pattern‑spotting in rocks .
Steno’s principles and modern formulations
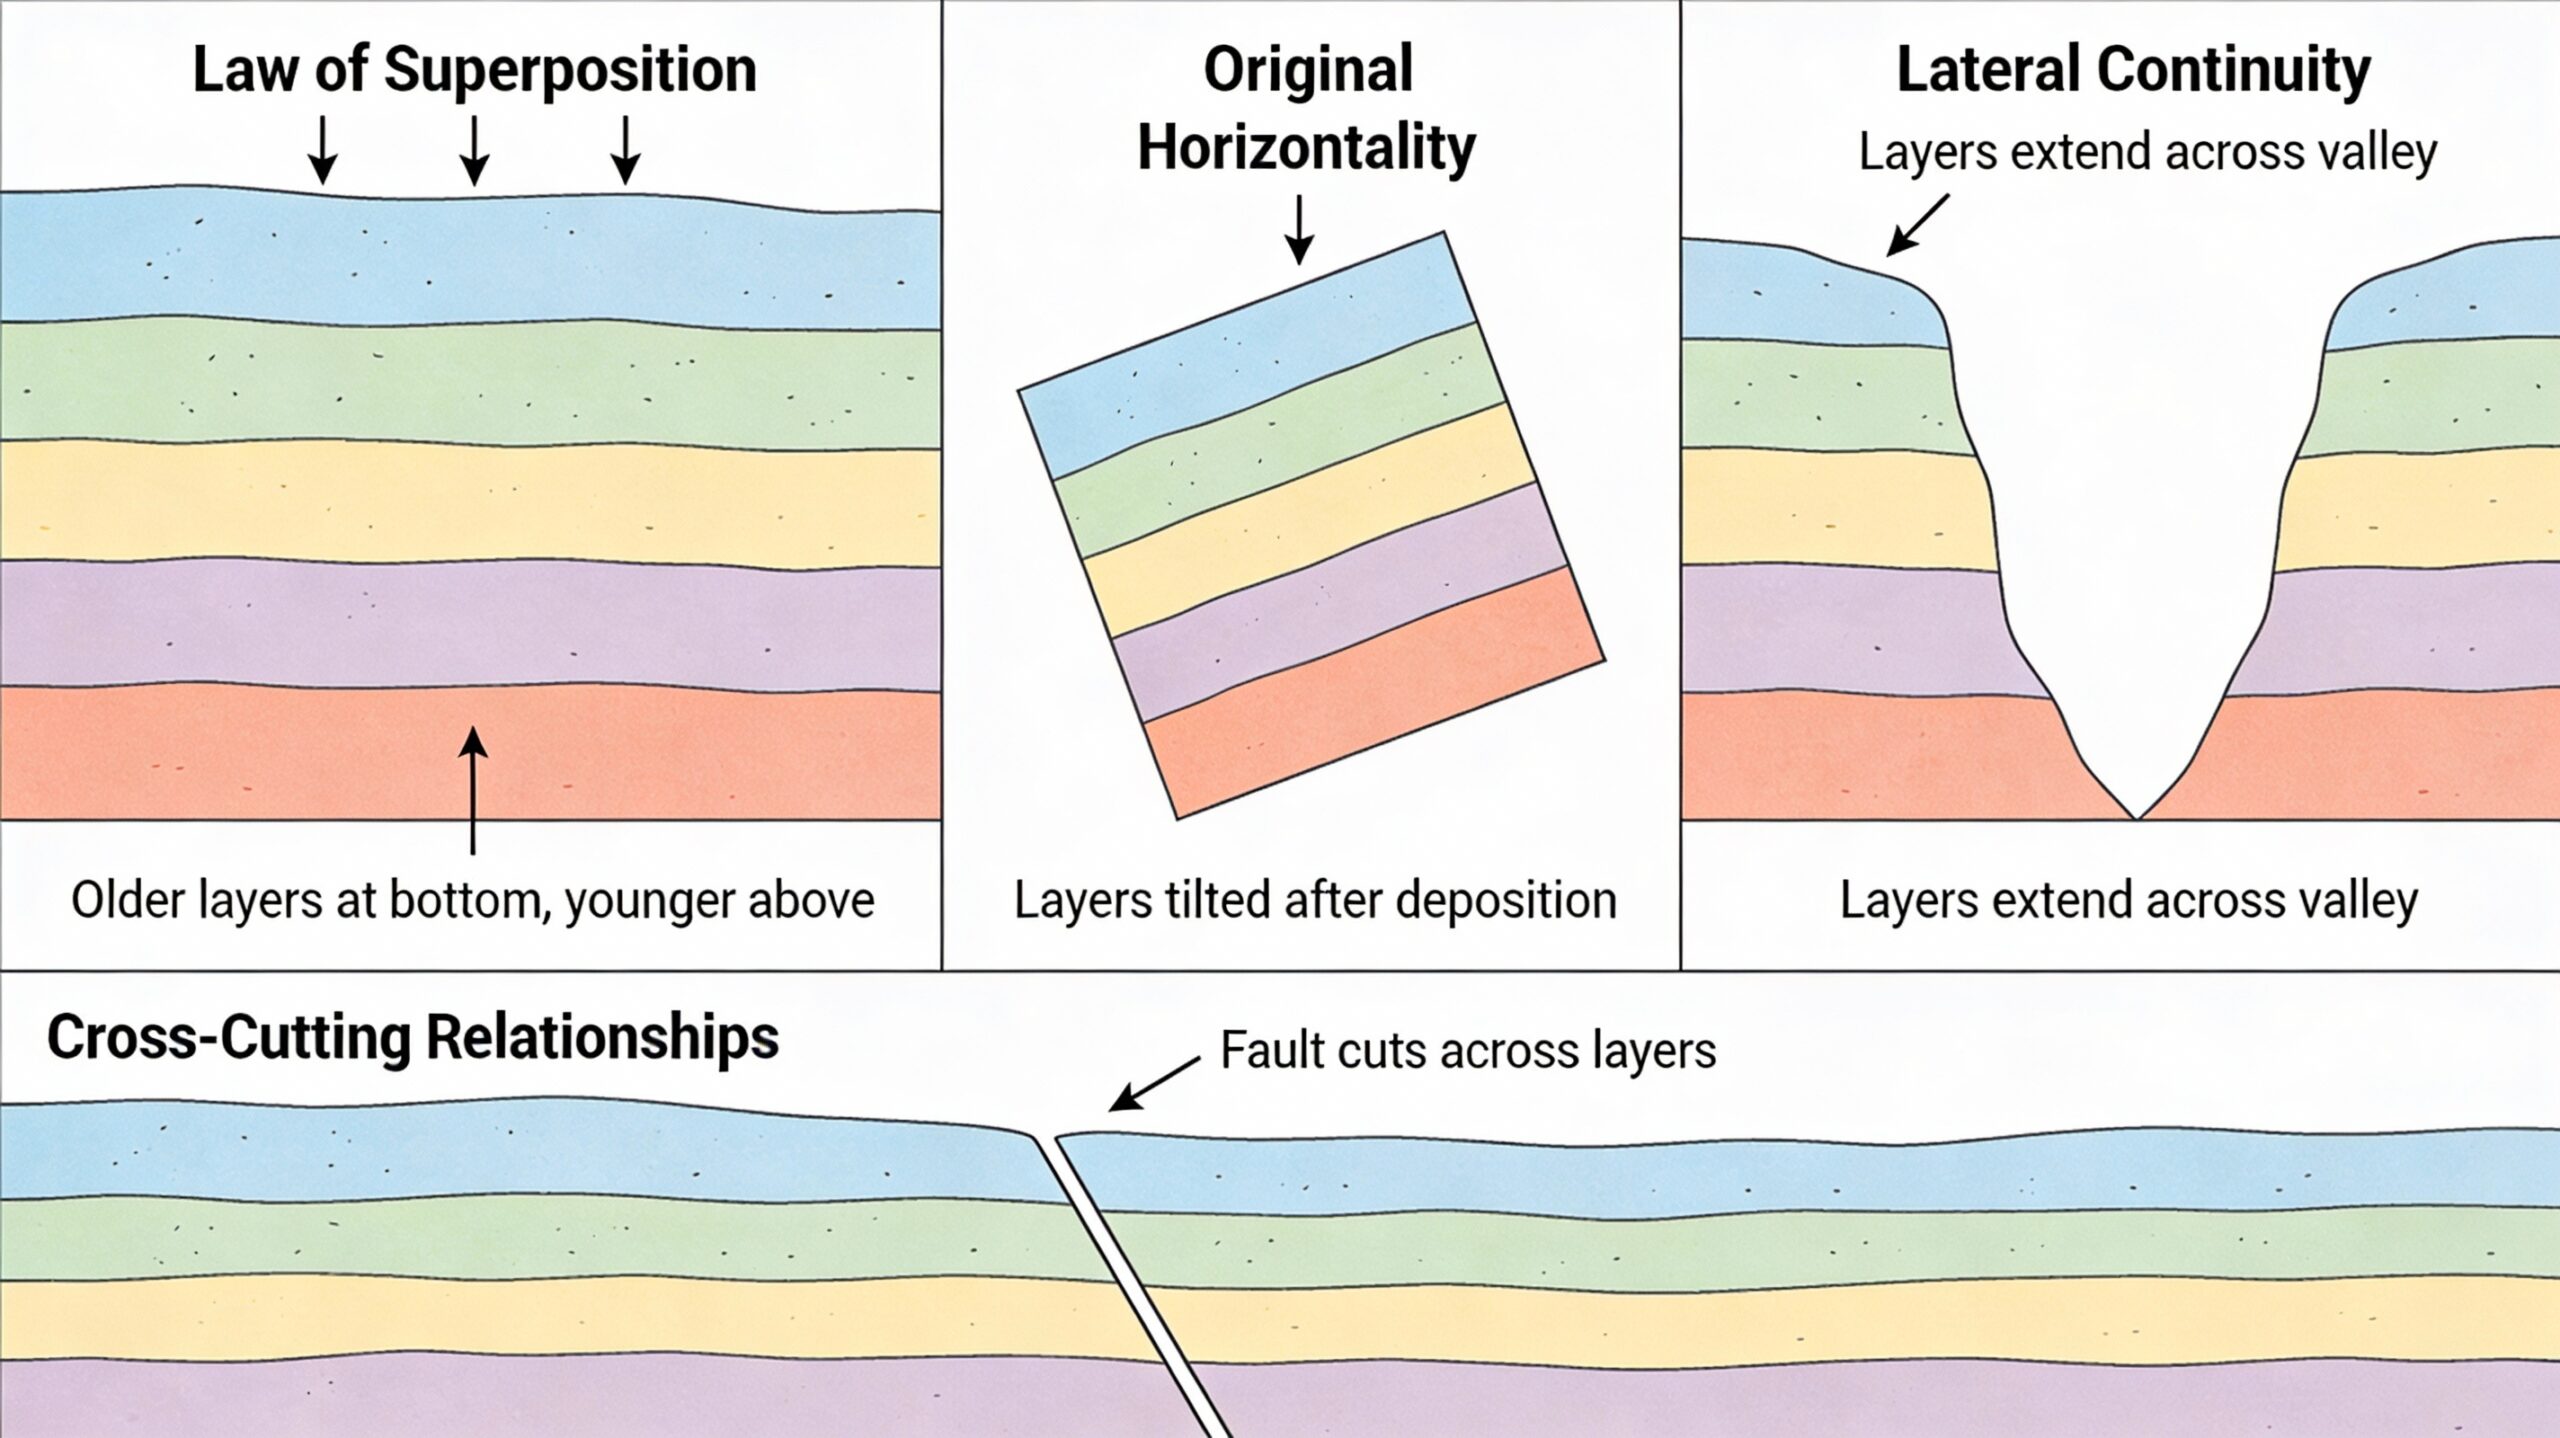
Most modern discussions of stratigraphy still begin with the principles articulated by Nicolaus Steno in the 17th century, because they remain the backbone of relative dating. These are commonly taught as original horizontality, superposition, lateral continuity, and cross‑cutting relationships, and they can be framed for learners as conditional rules with clear limits .
-
Original horizontality: Sediments (and many lava flows) are deposited approximately horizontally, so tilting or folding must have occurred after deposition.
-
Superposition: In an undisturbed sequence, lower layers are older than those above and younger than those below, providing a relative chronology even without numerical ages.
-
Lateral continuity: Layers initially extend sideways until they thin out, change facies, or meet a barrier, so matching beds separated by a valley or erosion can often be correlated.
-
Cross‑cutting relationships: Any feature that cuts across layers—faults, intrusions, erosional surfaces—is younger than the units it disrupts.
For more advanced learners, it helps to stress that these principles are starting assumptions that work best in relatively simple successions. The interesting work often begins when the record is deformed or eroded and the educator asks, “Where do these rules still help, and where does the outcrop tell us something more complicated happened?”.
Reading stories (and gaps) in the stratigraphic record
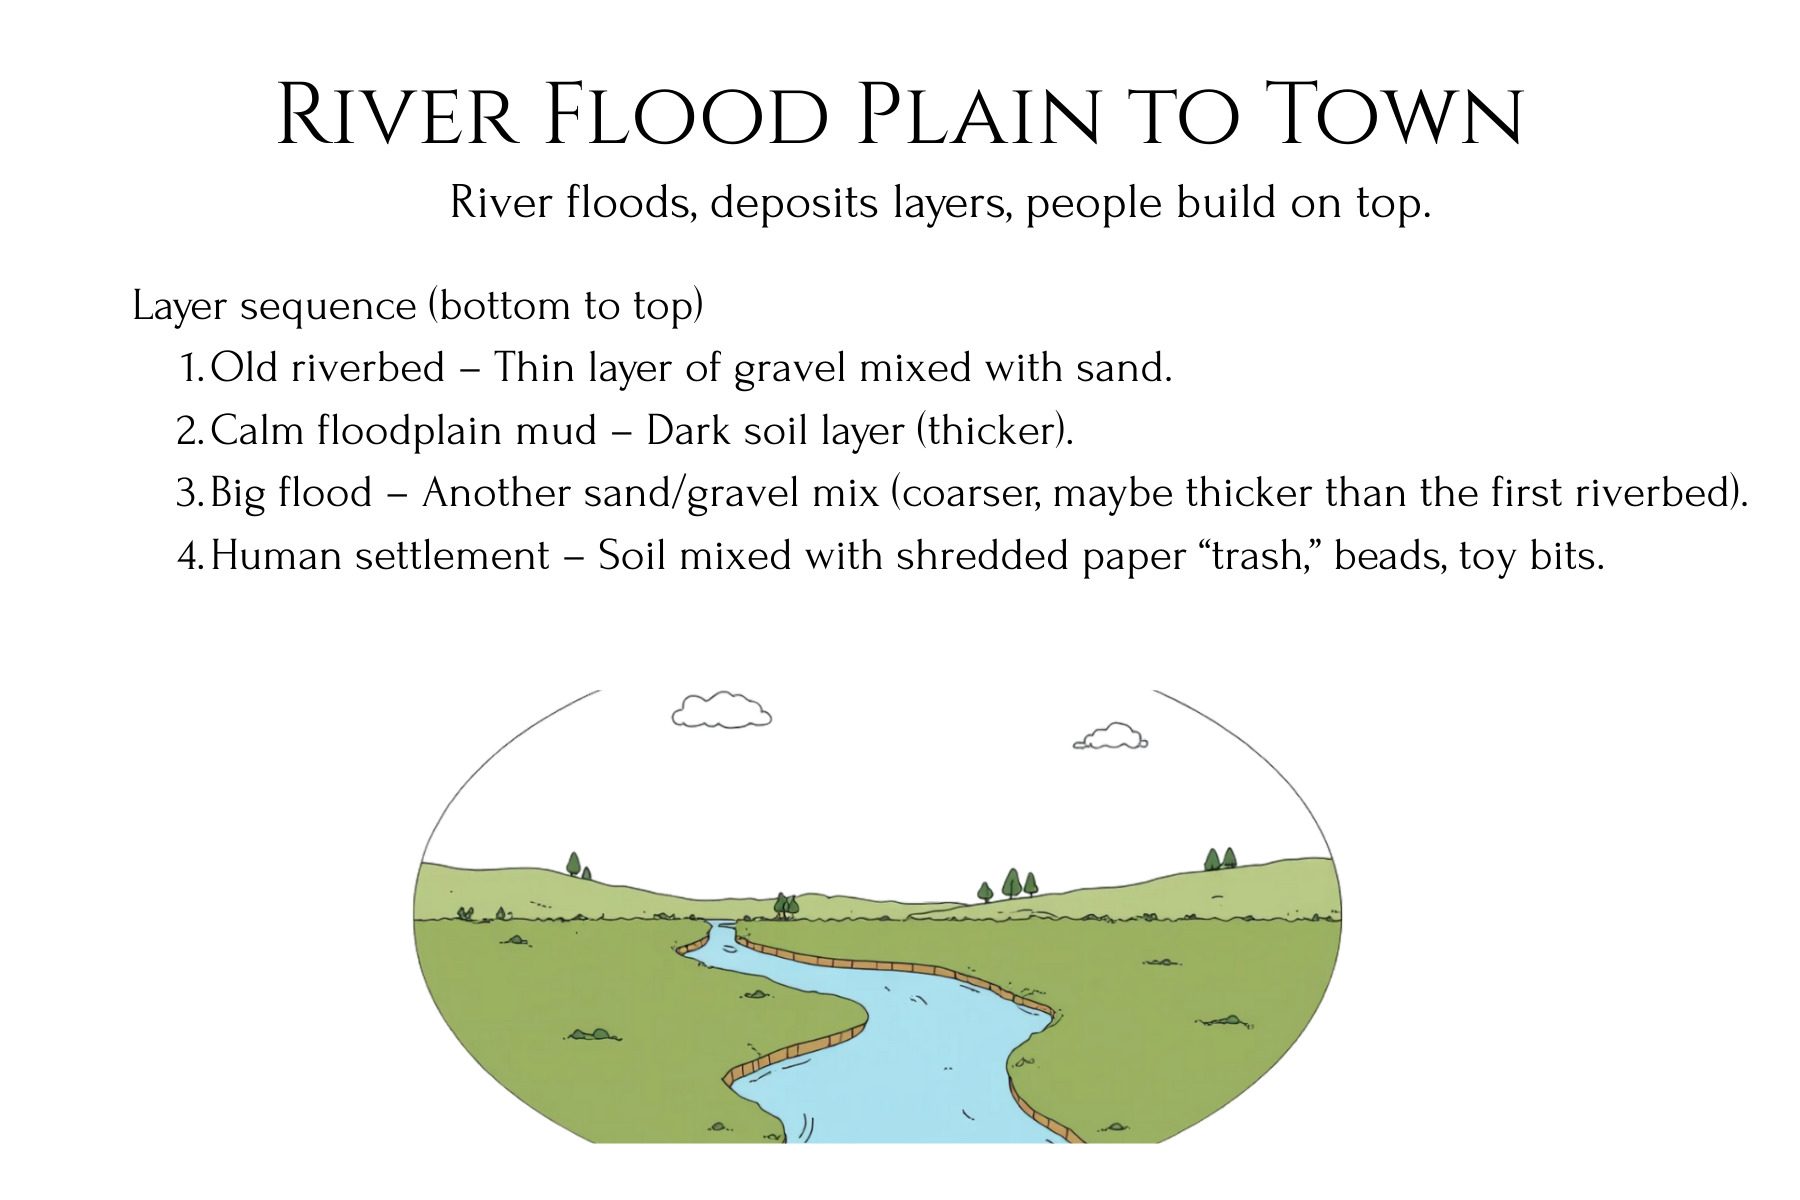
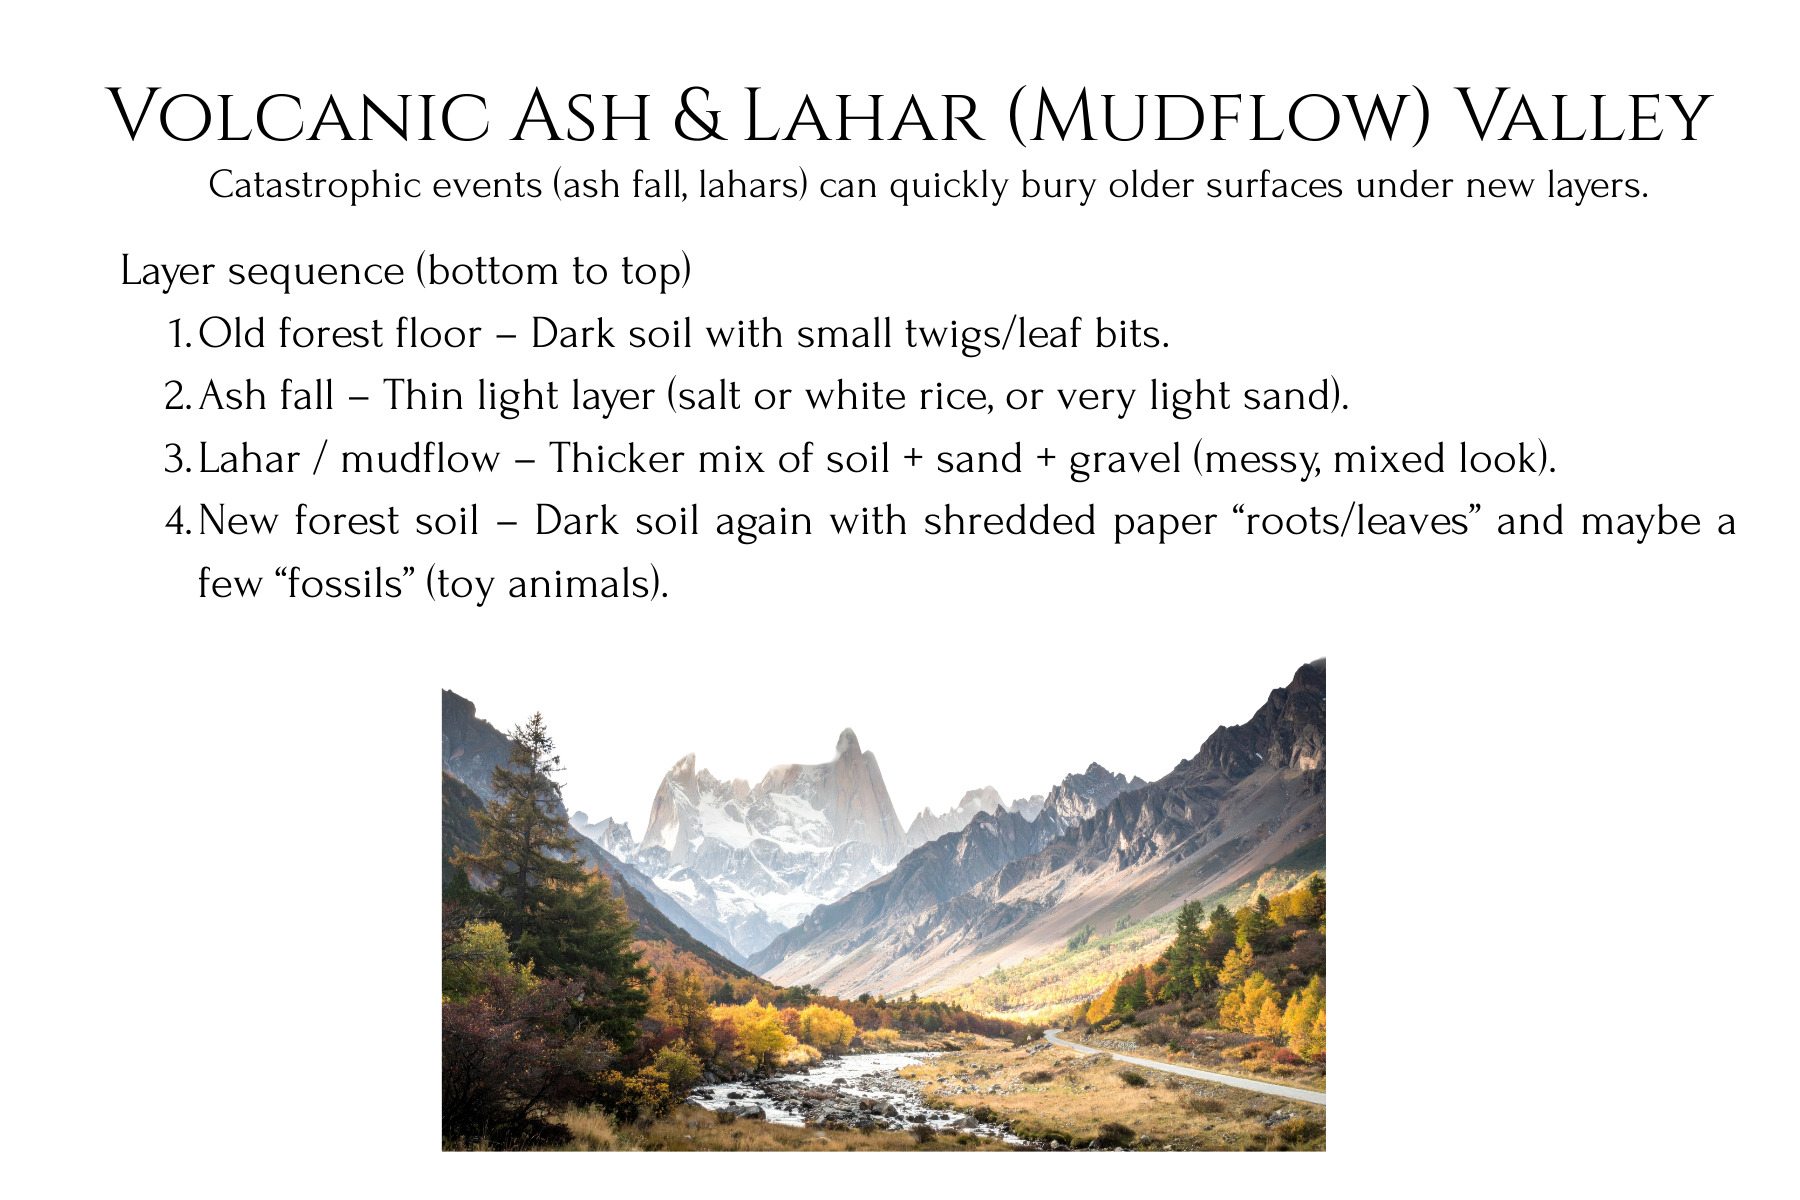
Once the core principles are in place, even small exposures become narratives of process and time. A basal conglomerate resting on weathered bedrock may indicate a high‑energy episode—such as a flood—reworking an older landscape. Finer sands and muds above can record a shift to lower‑energy fluvial or lacustrine conditions, while a thin ash or distinctive layer can act as a marker bed that can be traced across broader regions.
Just as important for teaching is the idea of unconformities—surfaces that represent missing time where deposition stopped, erosion removed previously formed strata, or both. When learners learn to recognize that a sharp, flat contact might represent millions of unrecorded years, they start to see the stratigraphic record as both a story and a set of gaps where chapters have been lost. That realization opens the door naturally to the question of how these stories connect to the larger sweep of Earth history .
From relative layers to geologic time
Up to this point, the focus is on relative chronology: what happened first, what came later, and where time is missing. The Geologic Time Scale is the framework that links those relative stories to named intervals and numerical ages, allowing local stratigraphic sequences to be placed into a global temporal context.
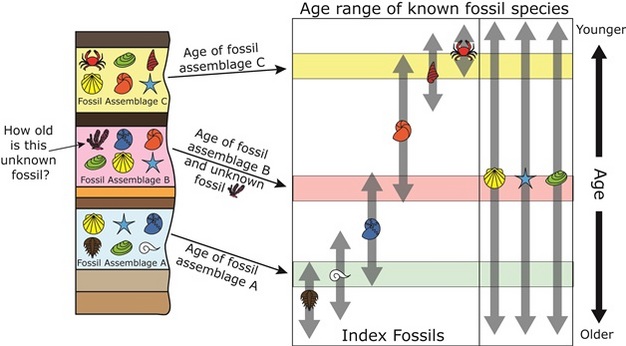
For educators, this is an ideal moment to distinguish clearly between relative and absolute time. Stratigraphy, fossils, and the principles above give the order of events; radiometric dating and global correlations anchor some of those boundaries in millions of years and define periods, epochs, and ages. When students understand that the same logic they used on a small stack of layers is also used to locate those layers within, say, the Devonian or the Quaternary, the Geologic Time Scale becomes less of a memorization chart and more of a map of stories they can read.
Practically, this can be introduced as a short, focused section: show a simplified time scale, pick one or two intervals, and connect them to stratigraphic “stories” they may already know (for example, marine fossils in Paleozoic carbonates, or glacial deposits in Pleistocene sediments). The key message is that stratigraphy provides the relative sequence, and the Geologic Time Scale is how geoscientists synchronize those sequences across the planet.
Why model stratigraphy with classroom activities
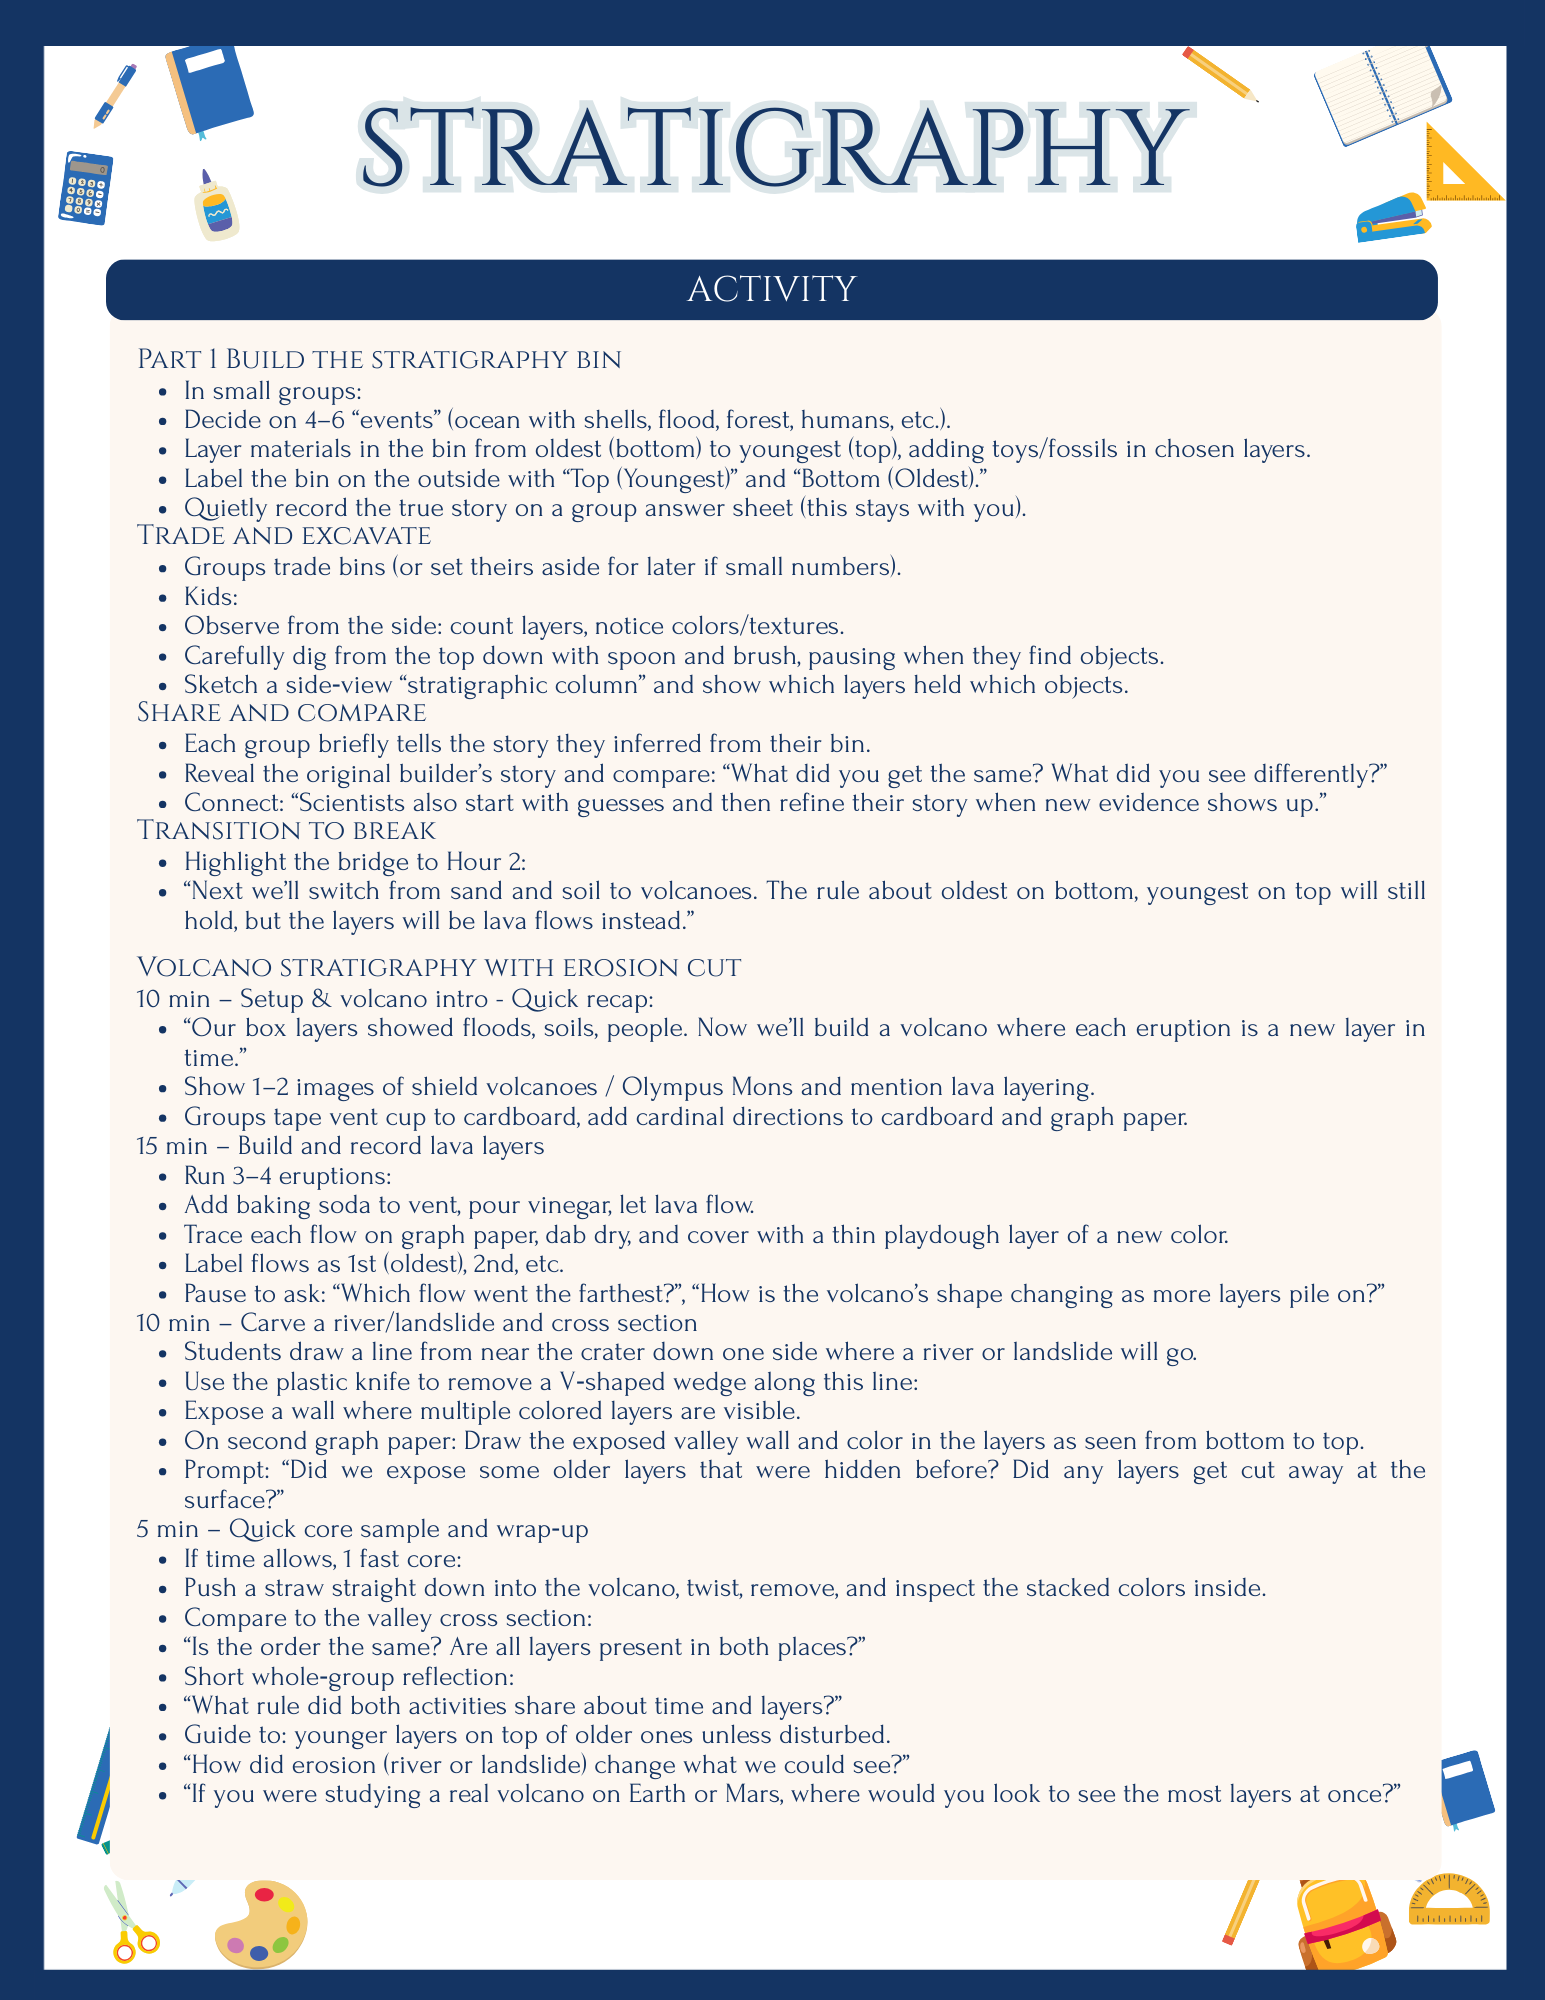
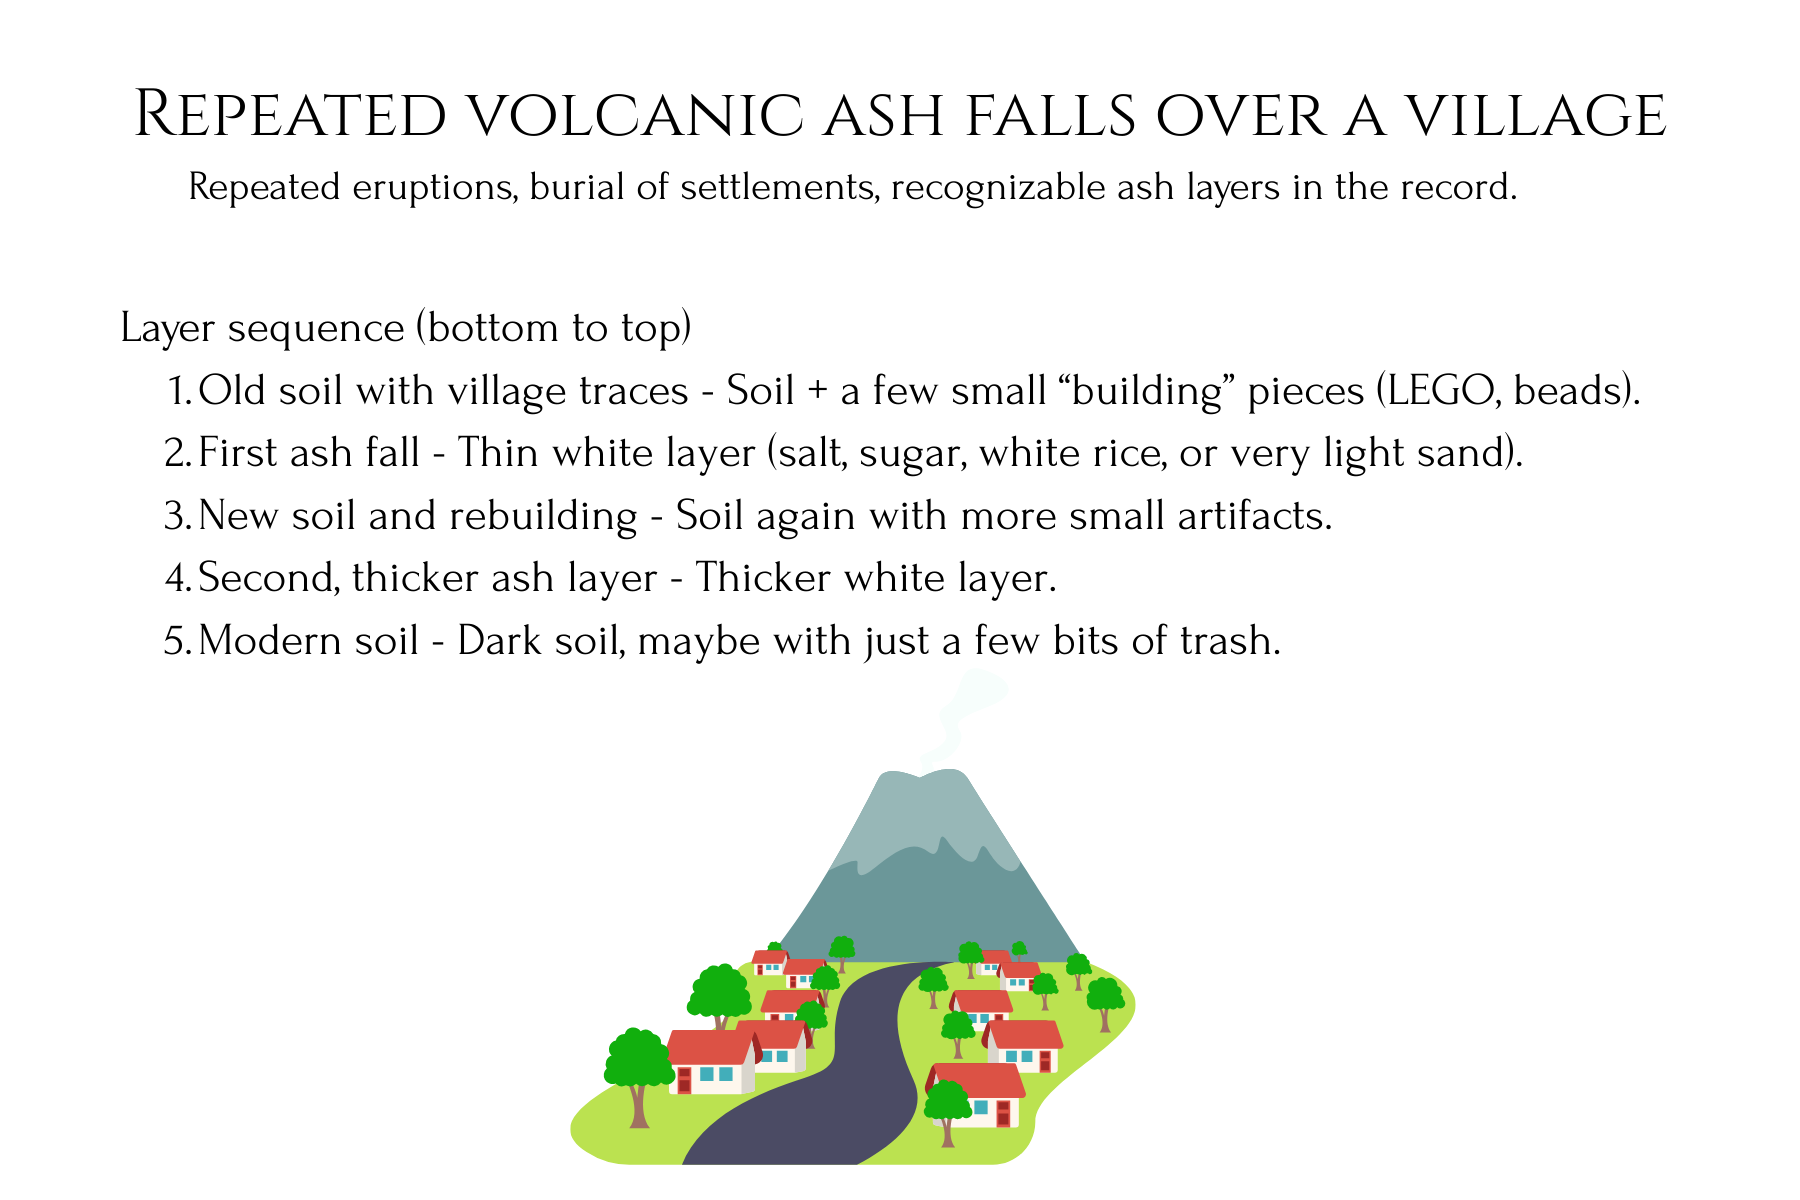
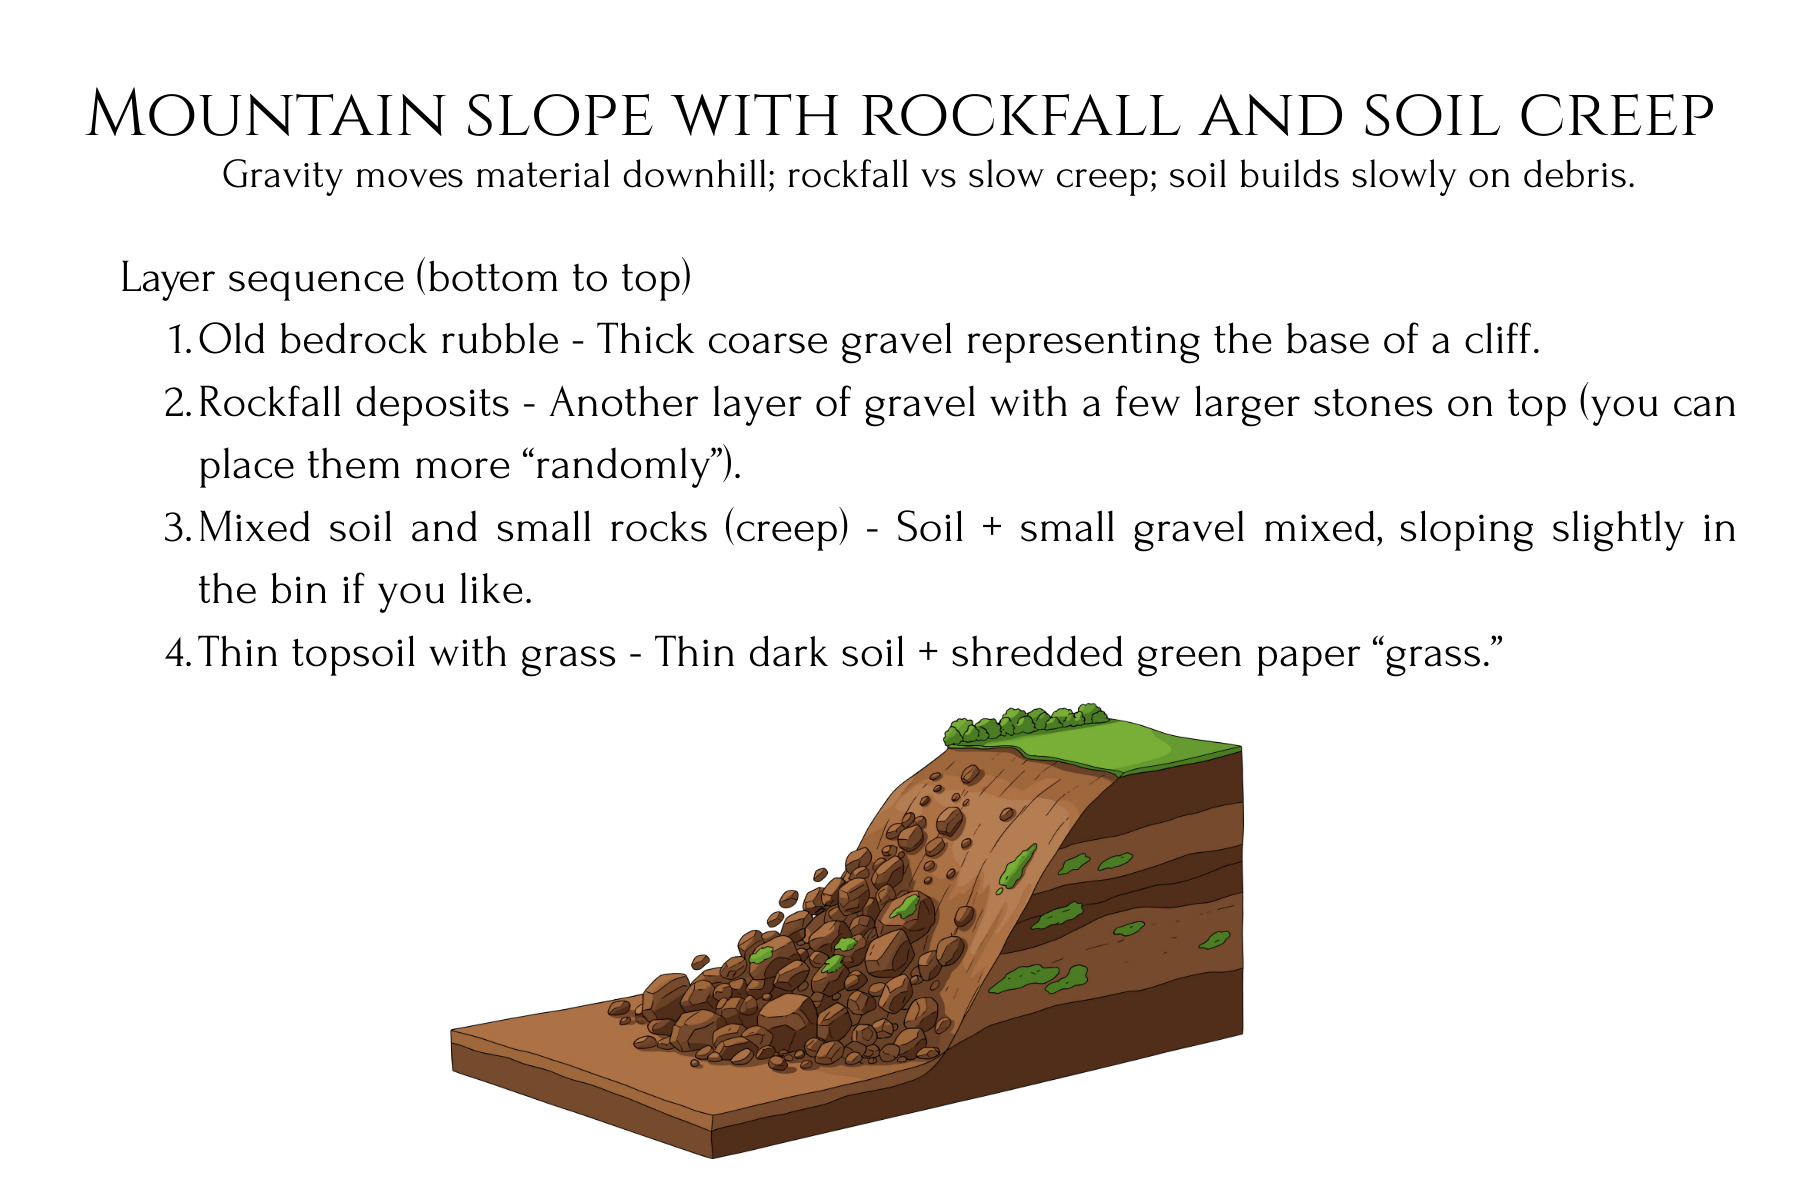
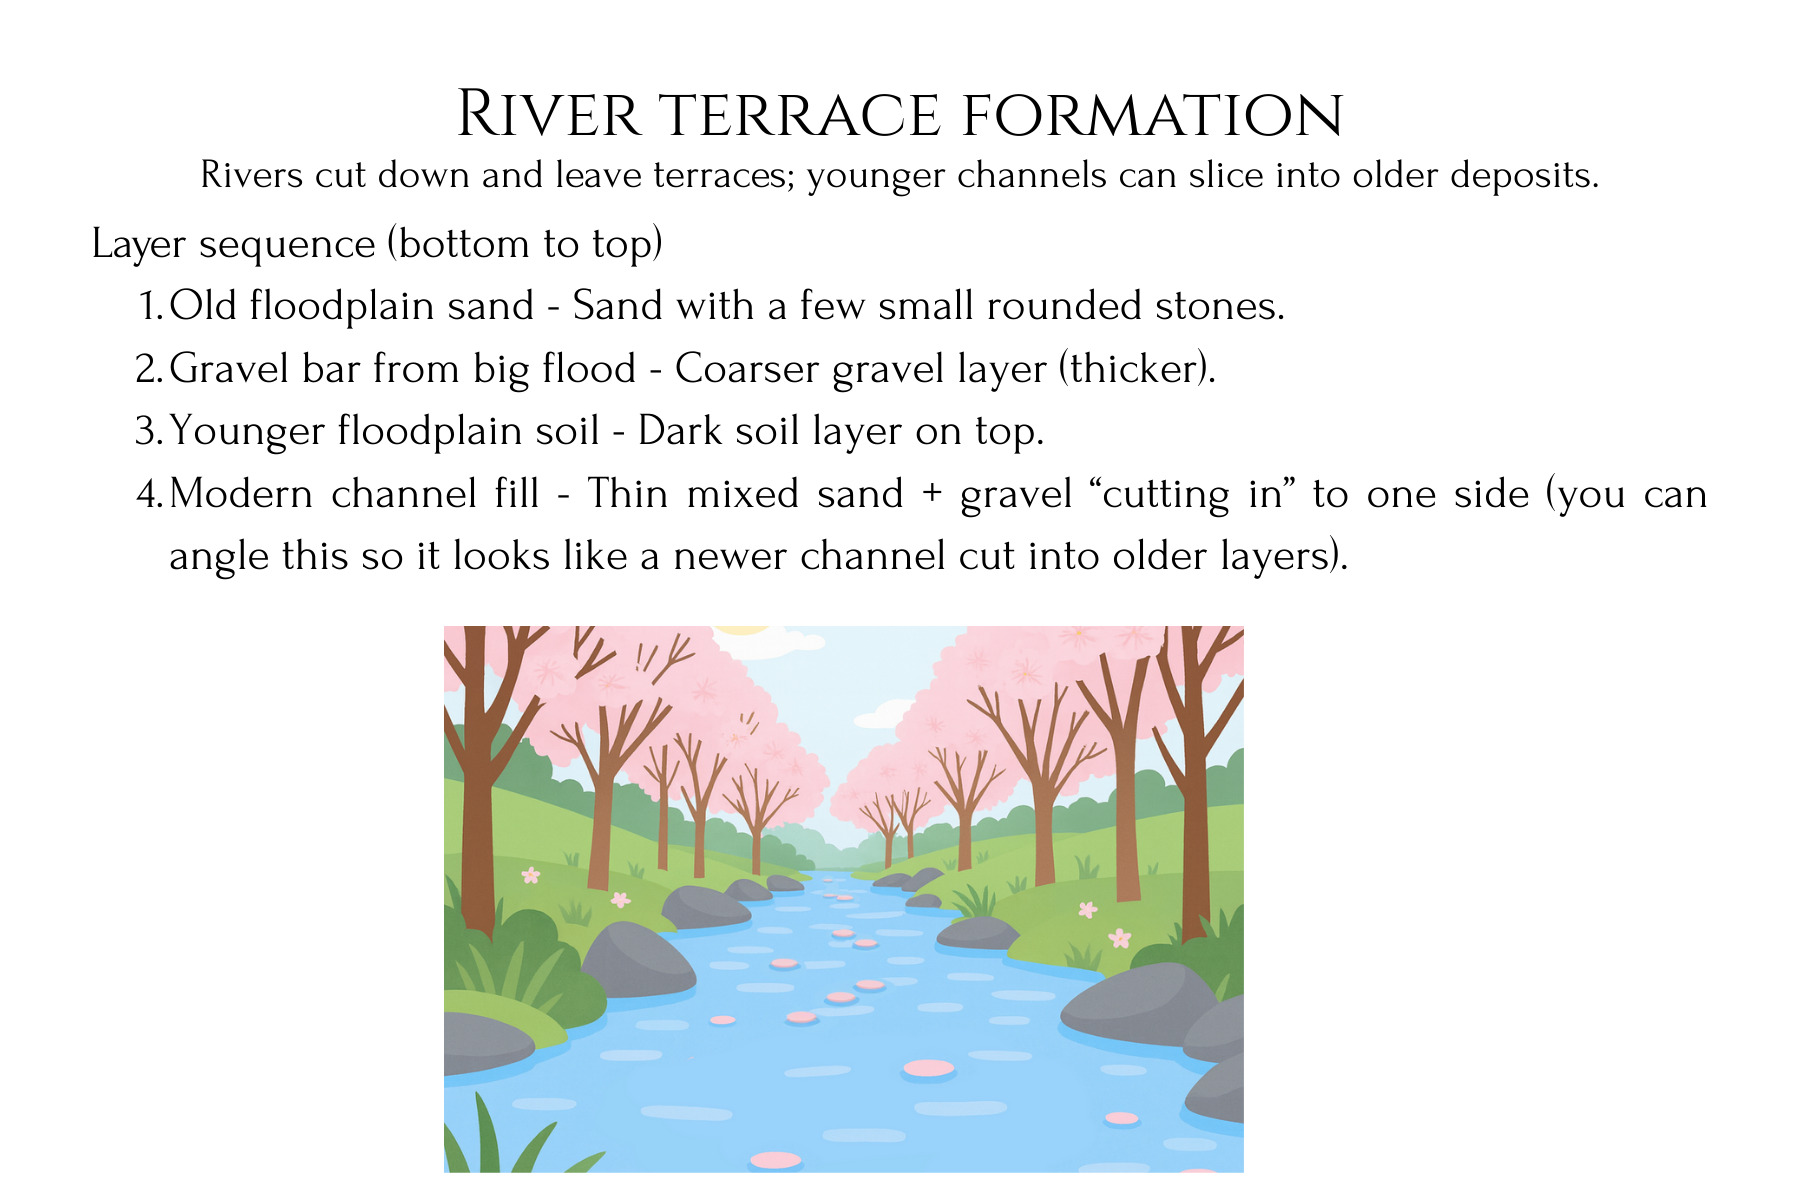
Hands‑on models—whether they use layered sediments in a clear tank, colored clays, or a volcano‑style build that produces stacked “deposits”—are powerful because they externalize abstract ideas into systems students can manipulate and interrogate. When participants create and then “excavate” their own stratigraphic sequences, they apply superposition, lateral continuity, and cross‑cutting relationships to a record whose history they know, and then test whether those rules allow them to reconstruct hidden portions from partial evidence.
For more advanced learners, the activity can be extended by introducing deliberate complications: tilting or folding the model layers, removing sections to represent erosion, or inserting “intrusions” that cut across existing strata. These modifications make the transition from clean textbook examples to the messy, overprinted records seen in real outcrops and core samples, and they set up rich discussions about uncertainty, competing interpretations, and how stratigraphic reasoning scales from a tabletop model up to the planetary scale.


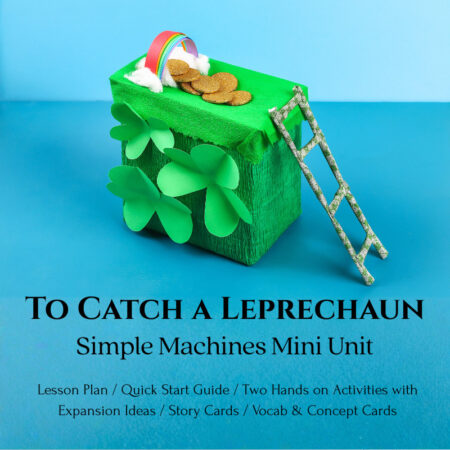
Reading Earth’s Diary: Mini Geology Unit on Stratigraphy
$ 5.00
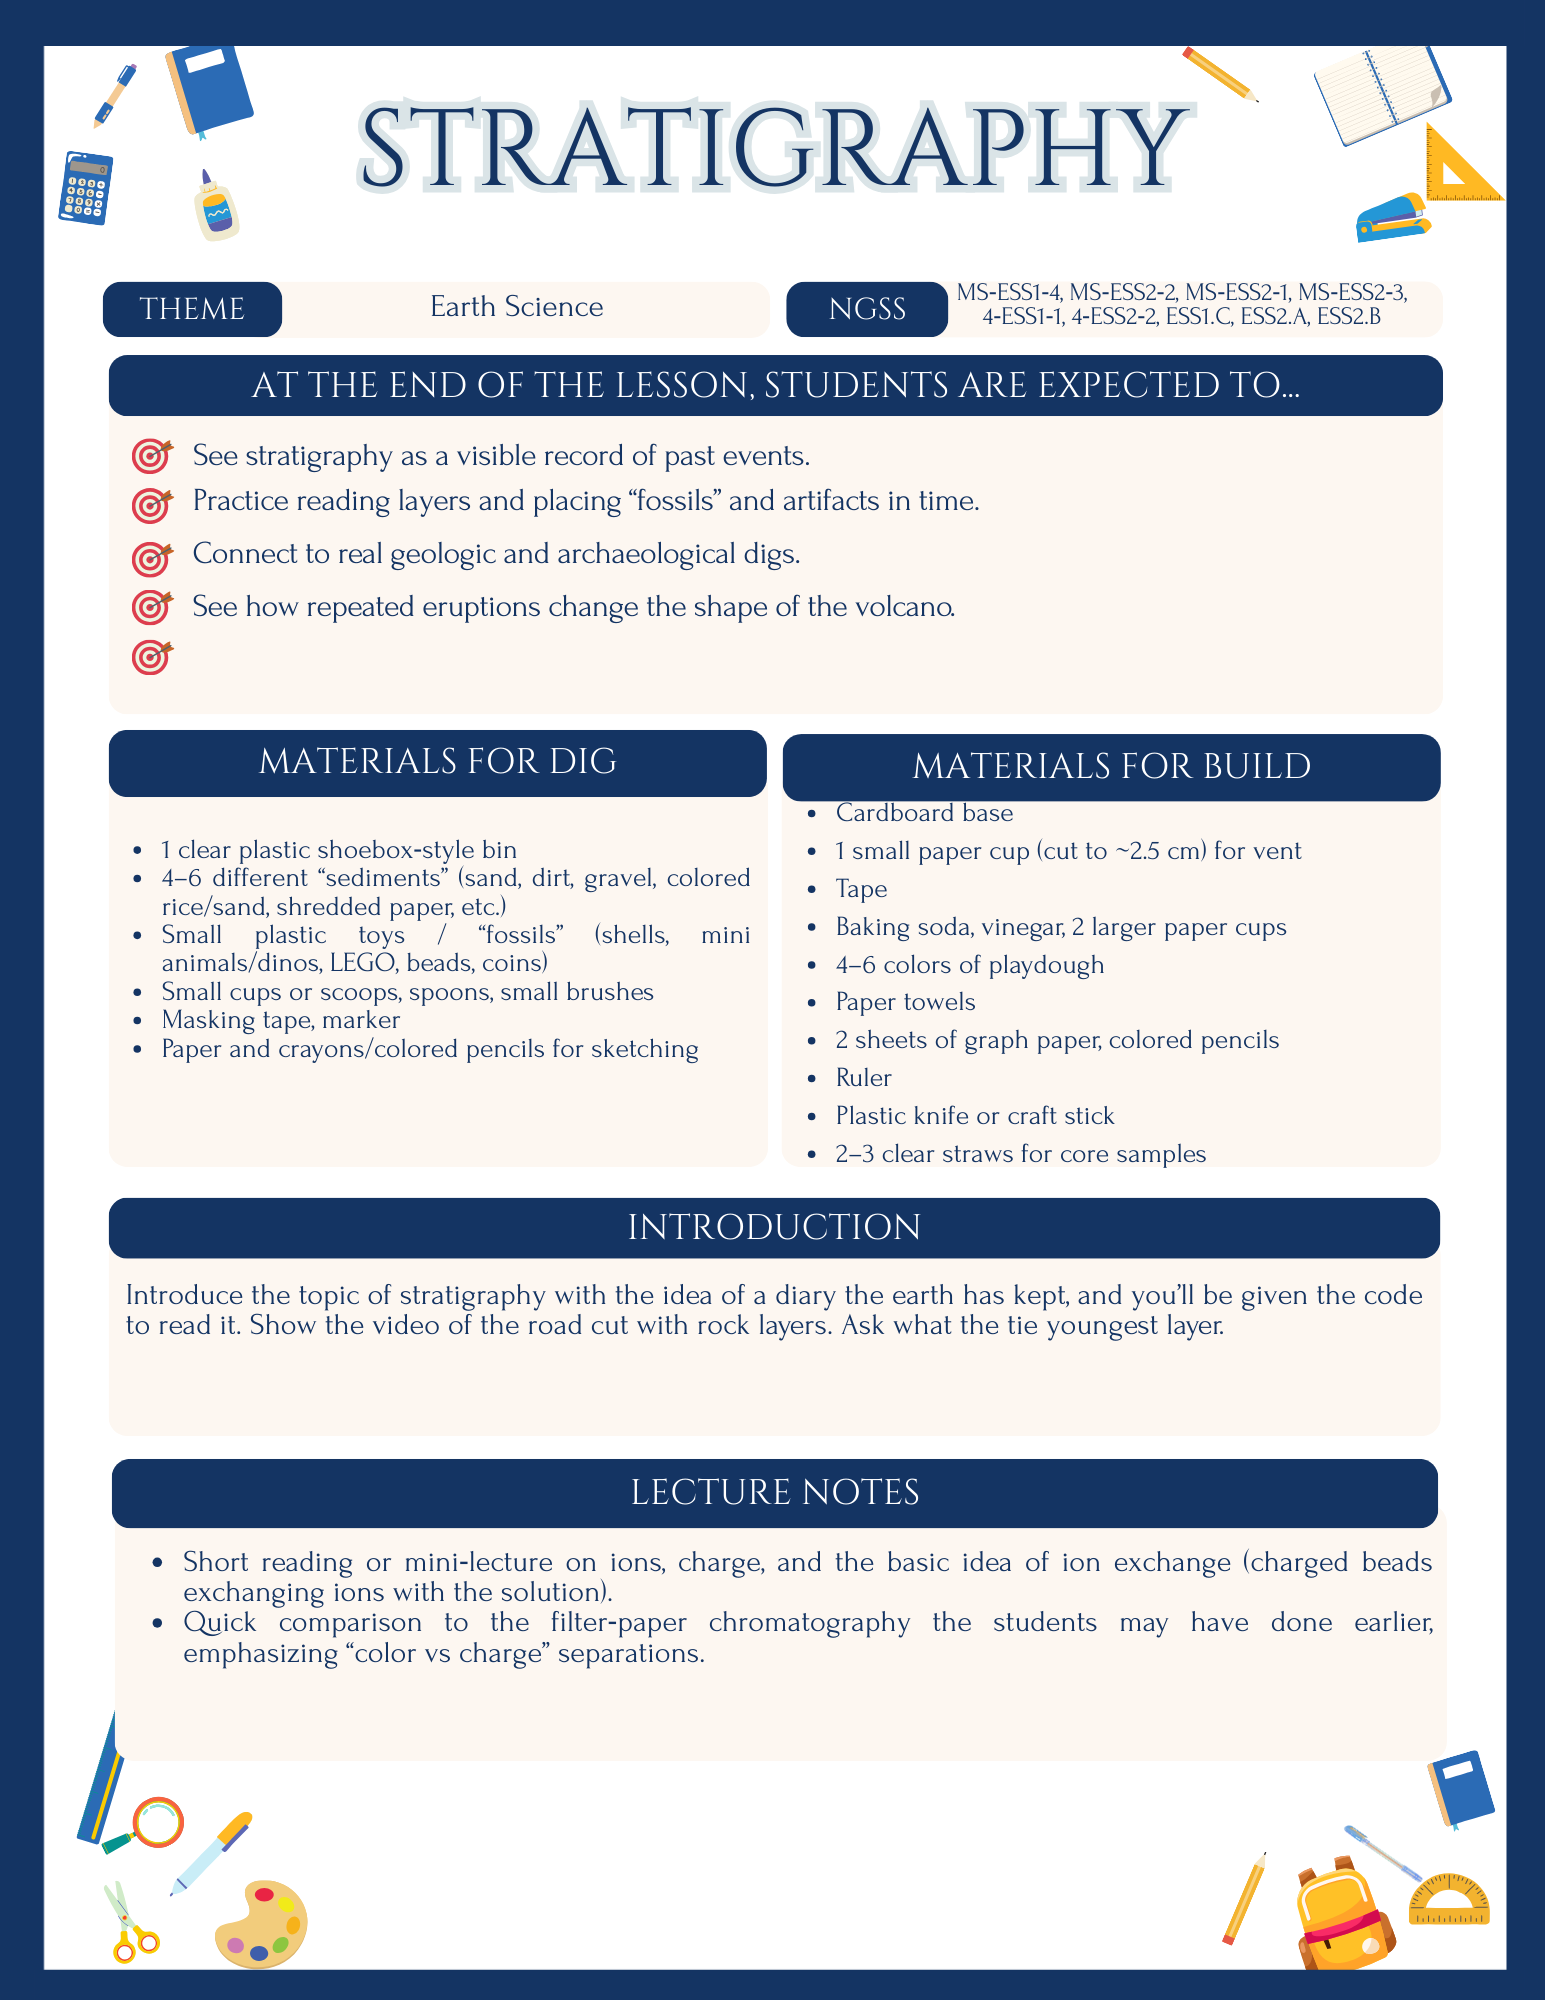
Guide students through a hands-on exploration of stratigraphy as they build, excavate, and map layered bins with landscape story cards, and model volcanoes to uncover Earth’s “diary” of past events. This NGSS‑aligned unit includes a full lesson plan, printable lab sheets, graph paper, and vocabulary supports for easy use in classrooms and homeschools.
Description
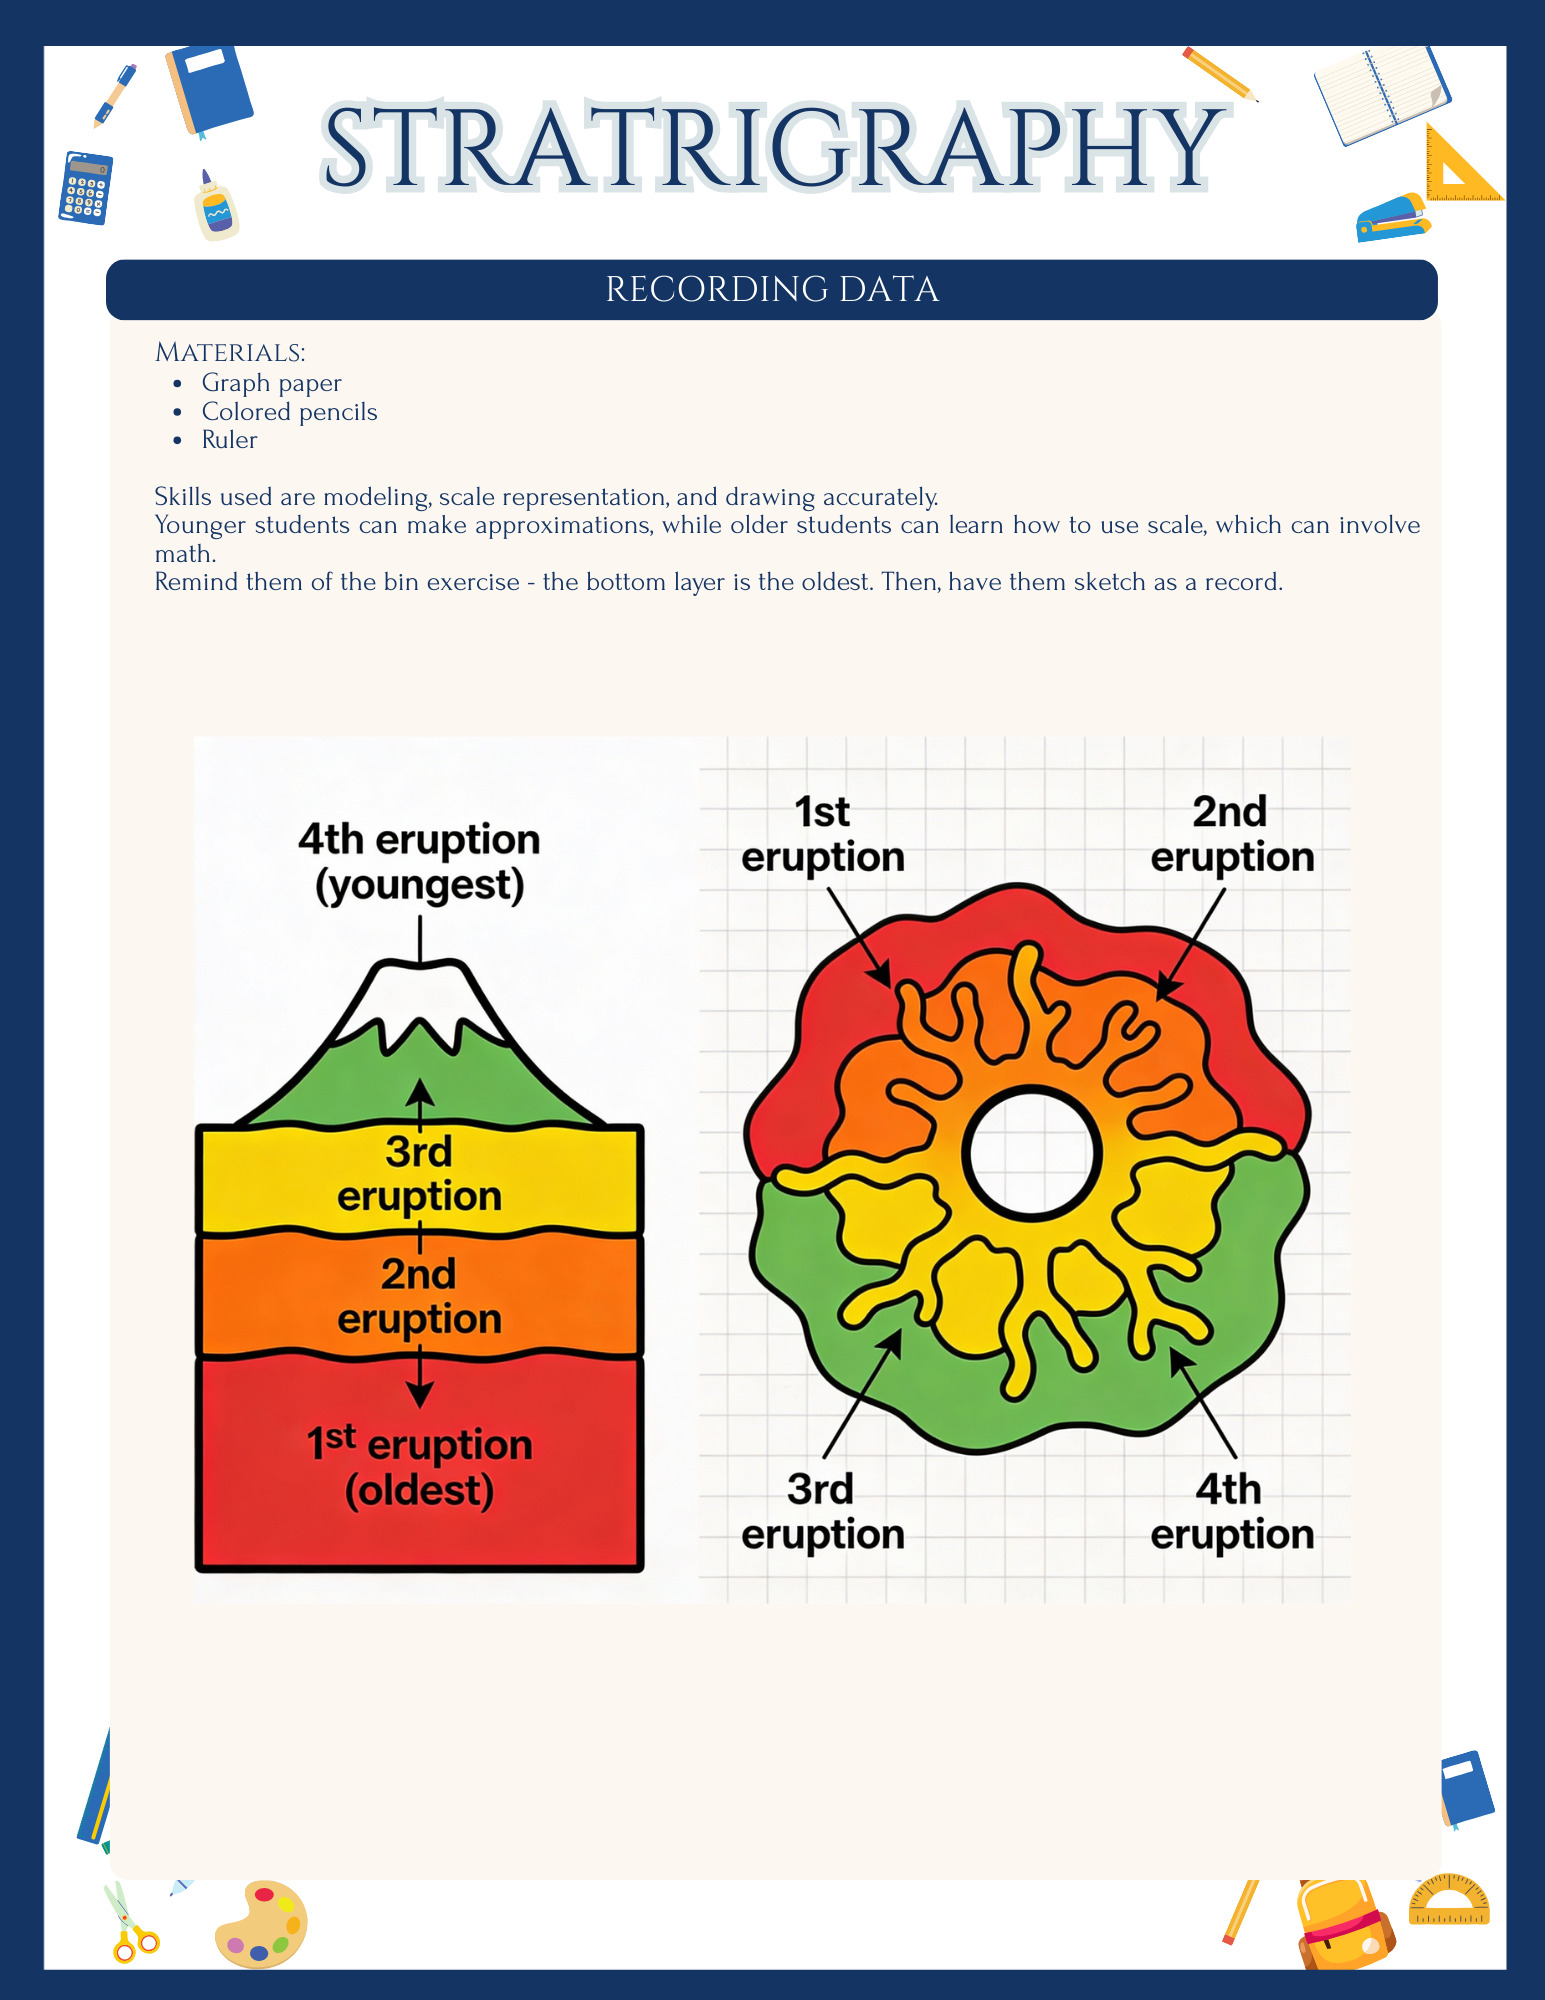
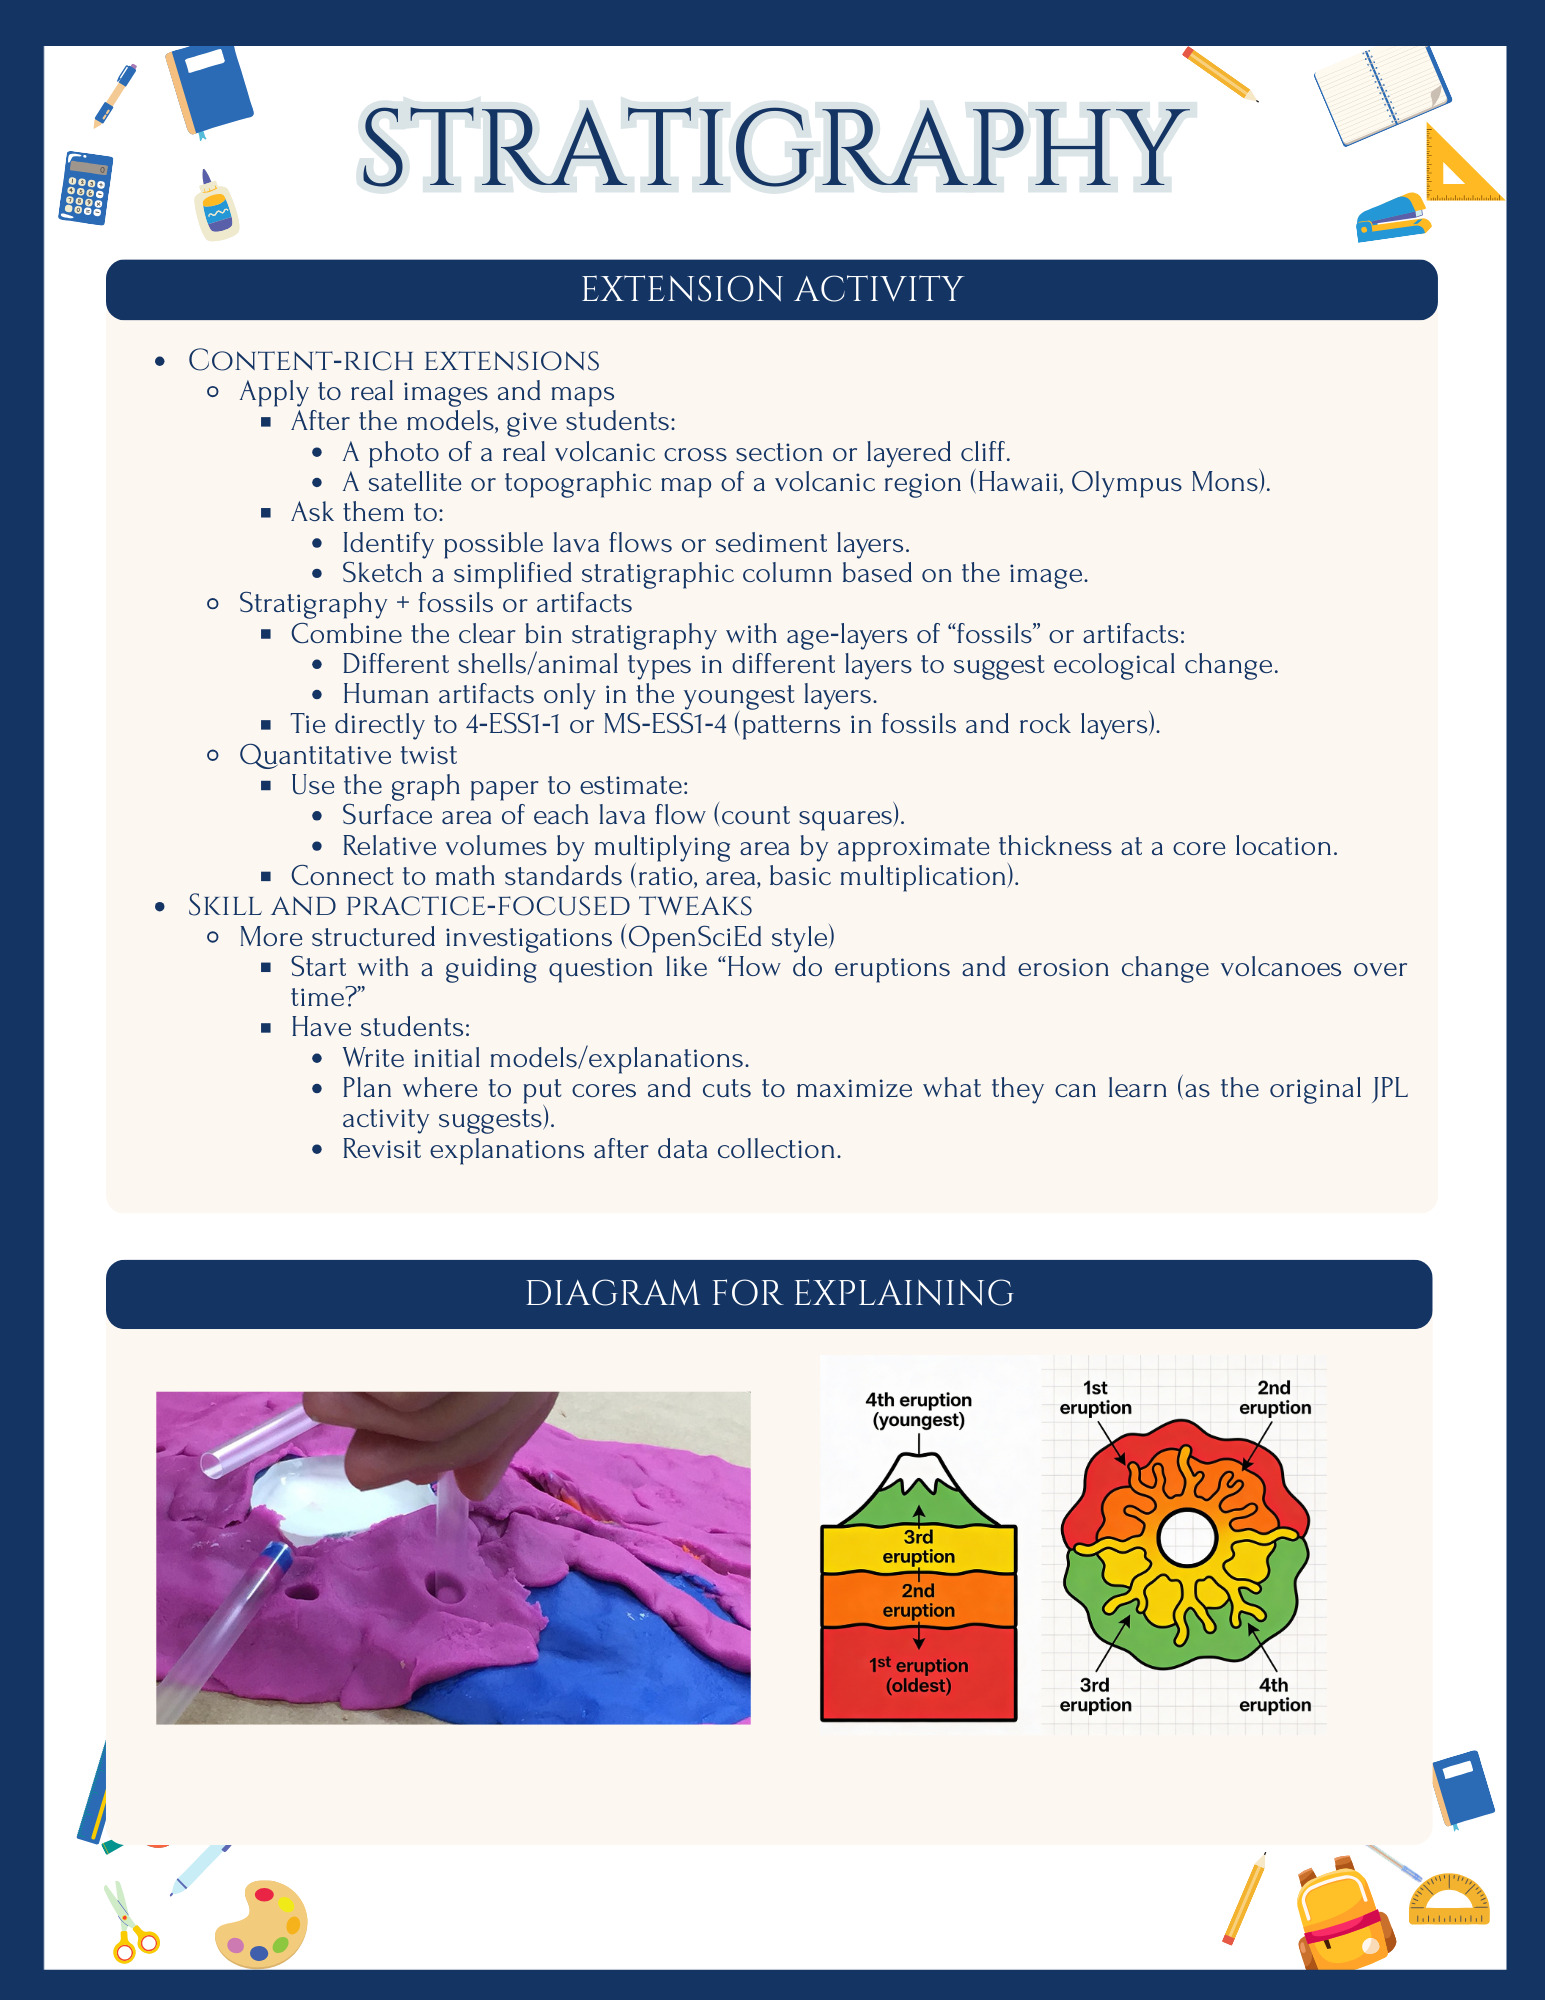
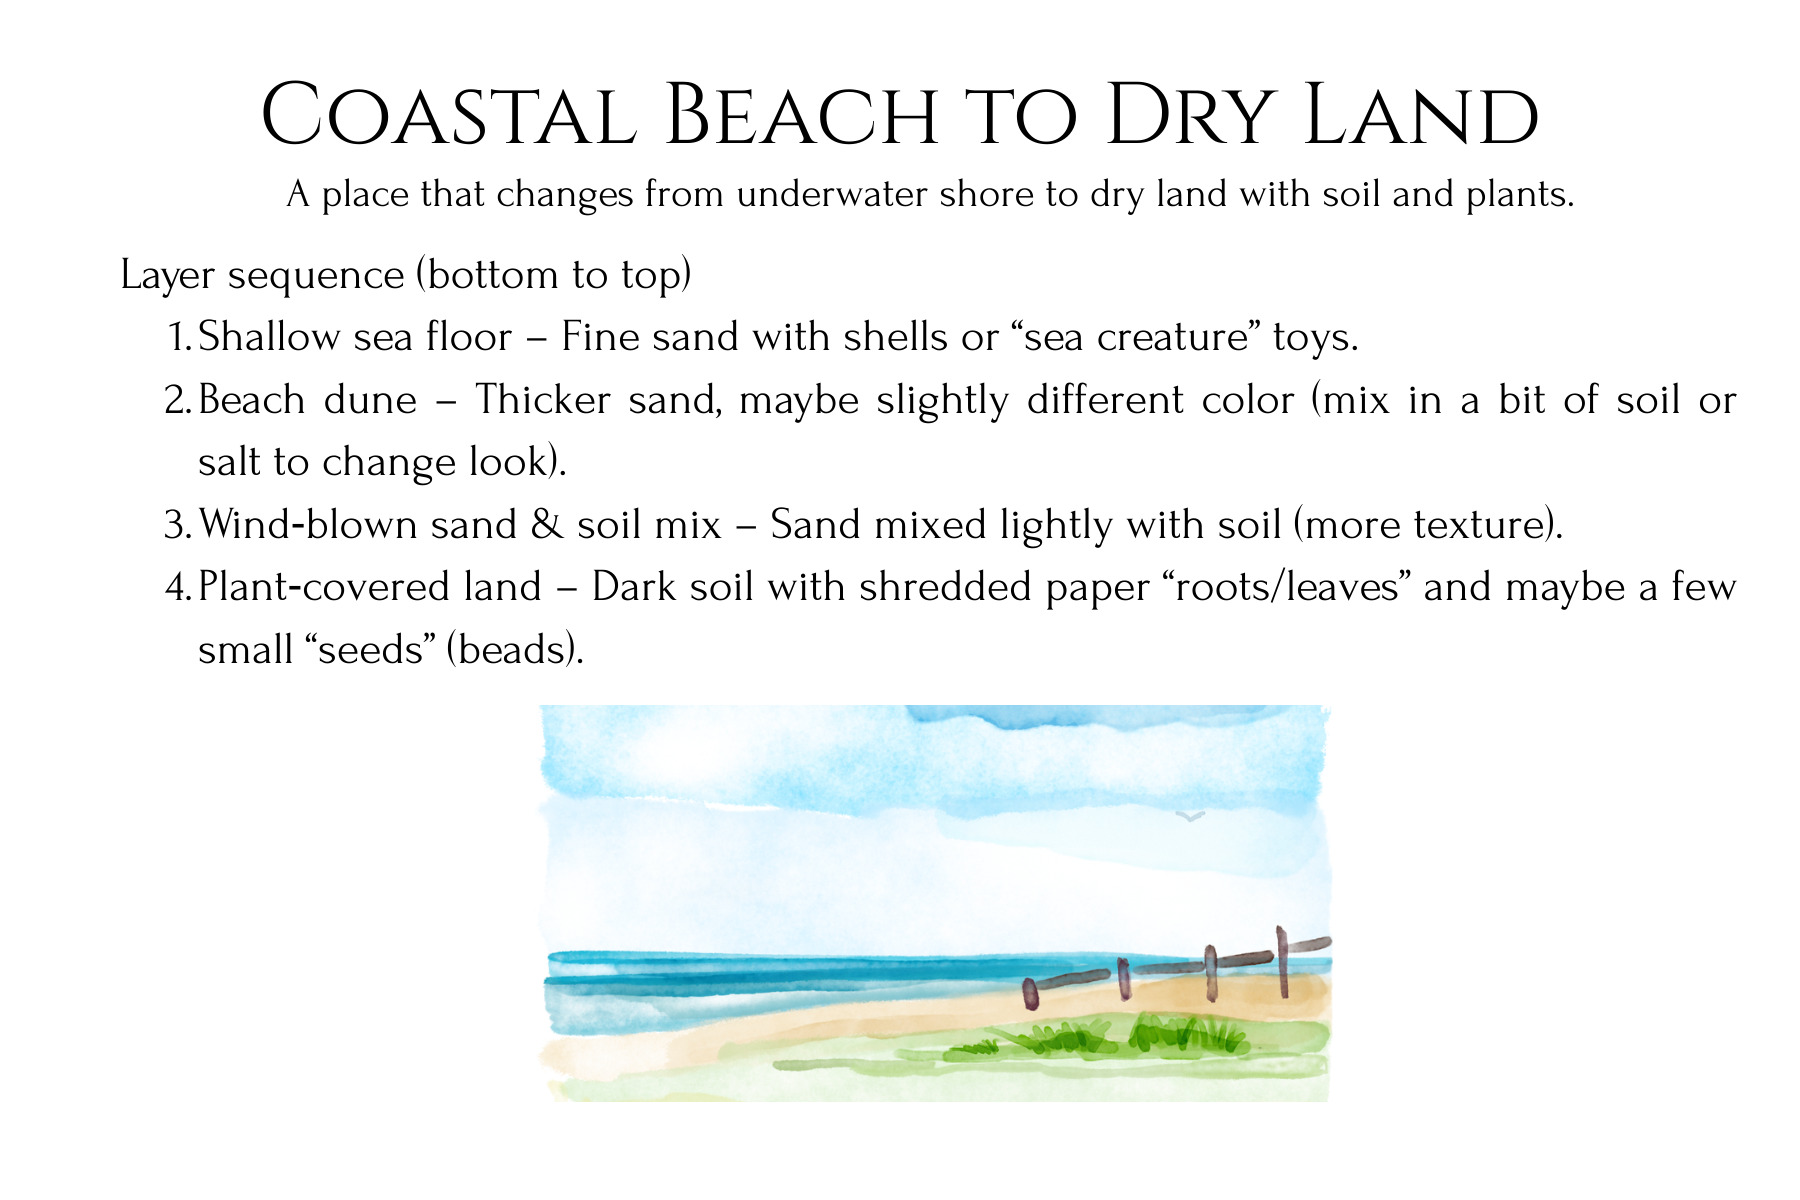
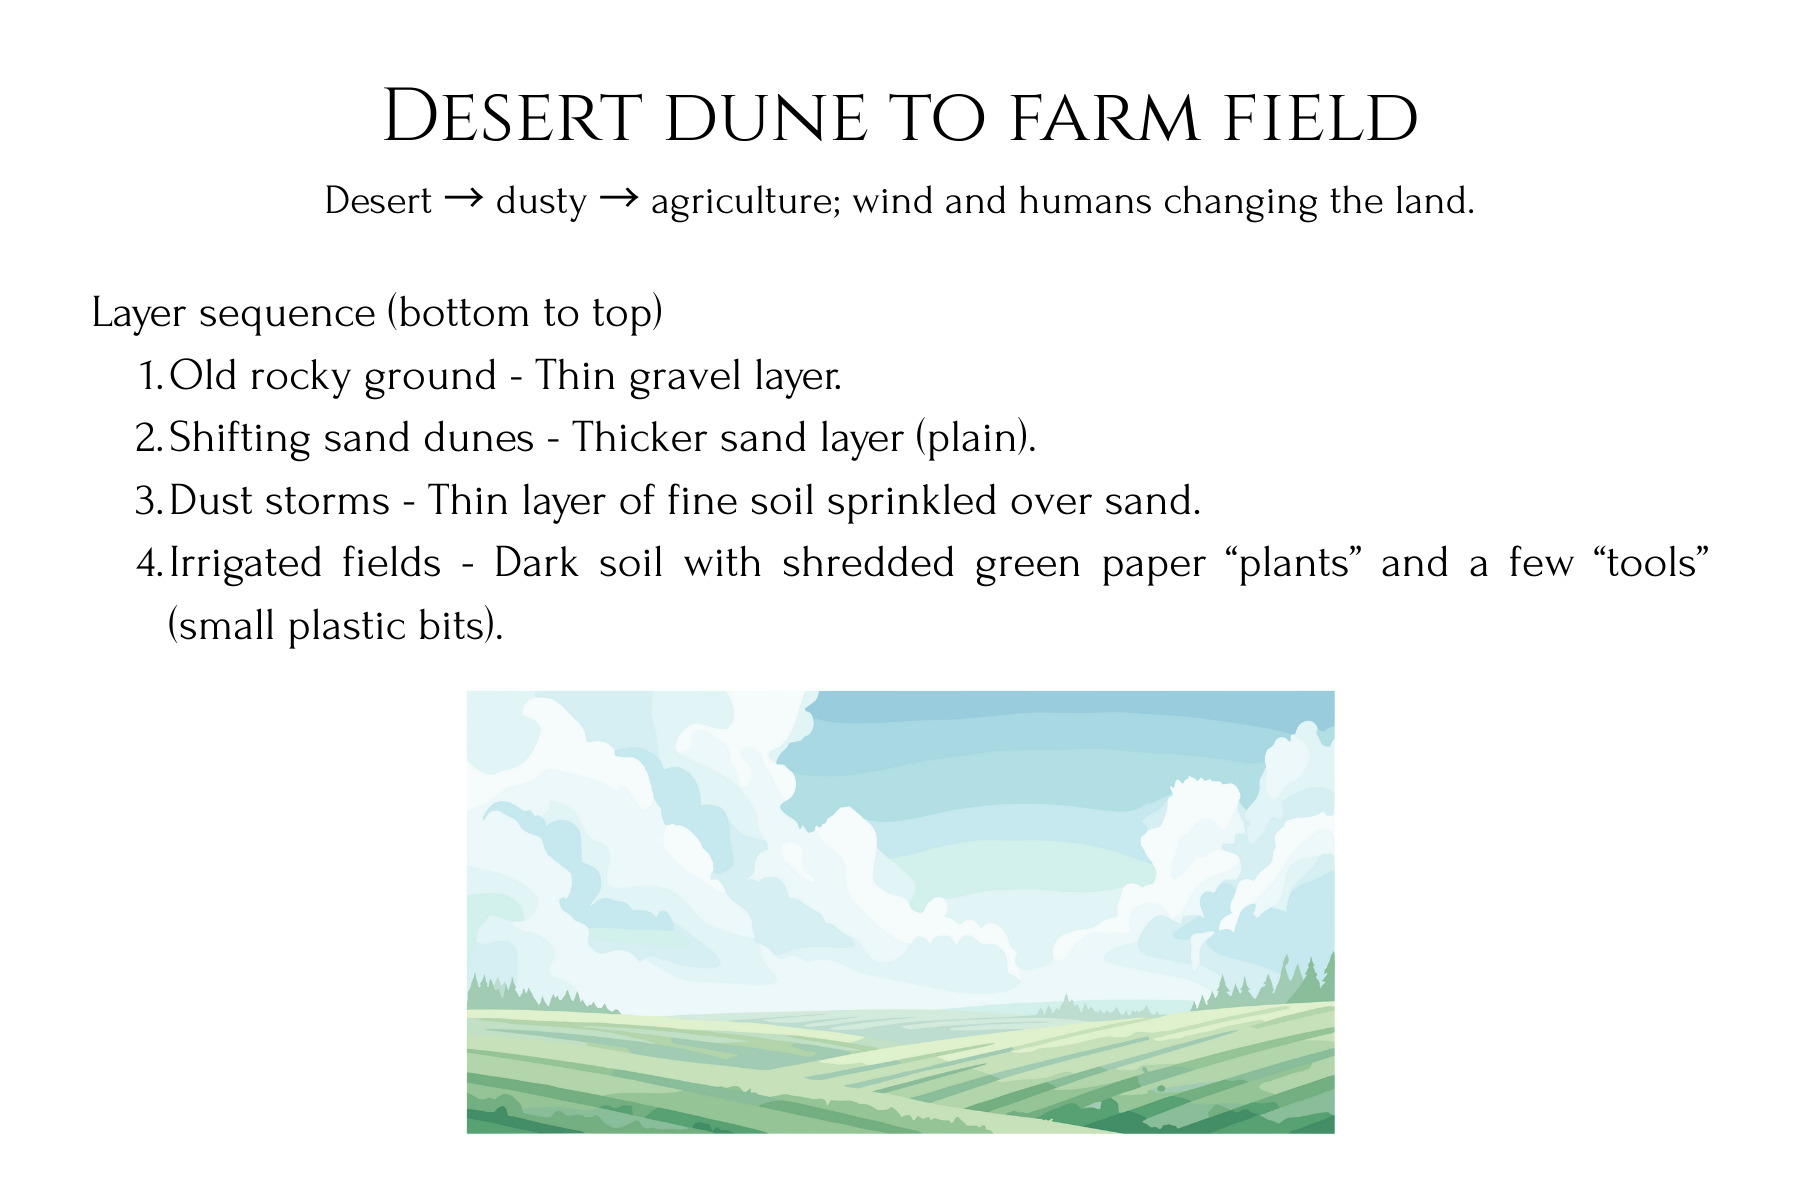
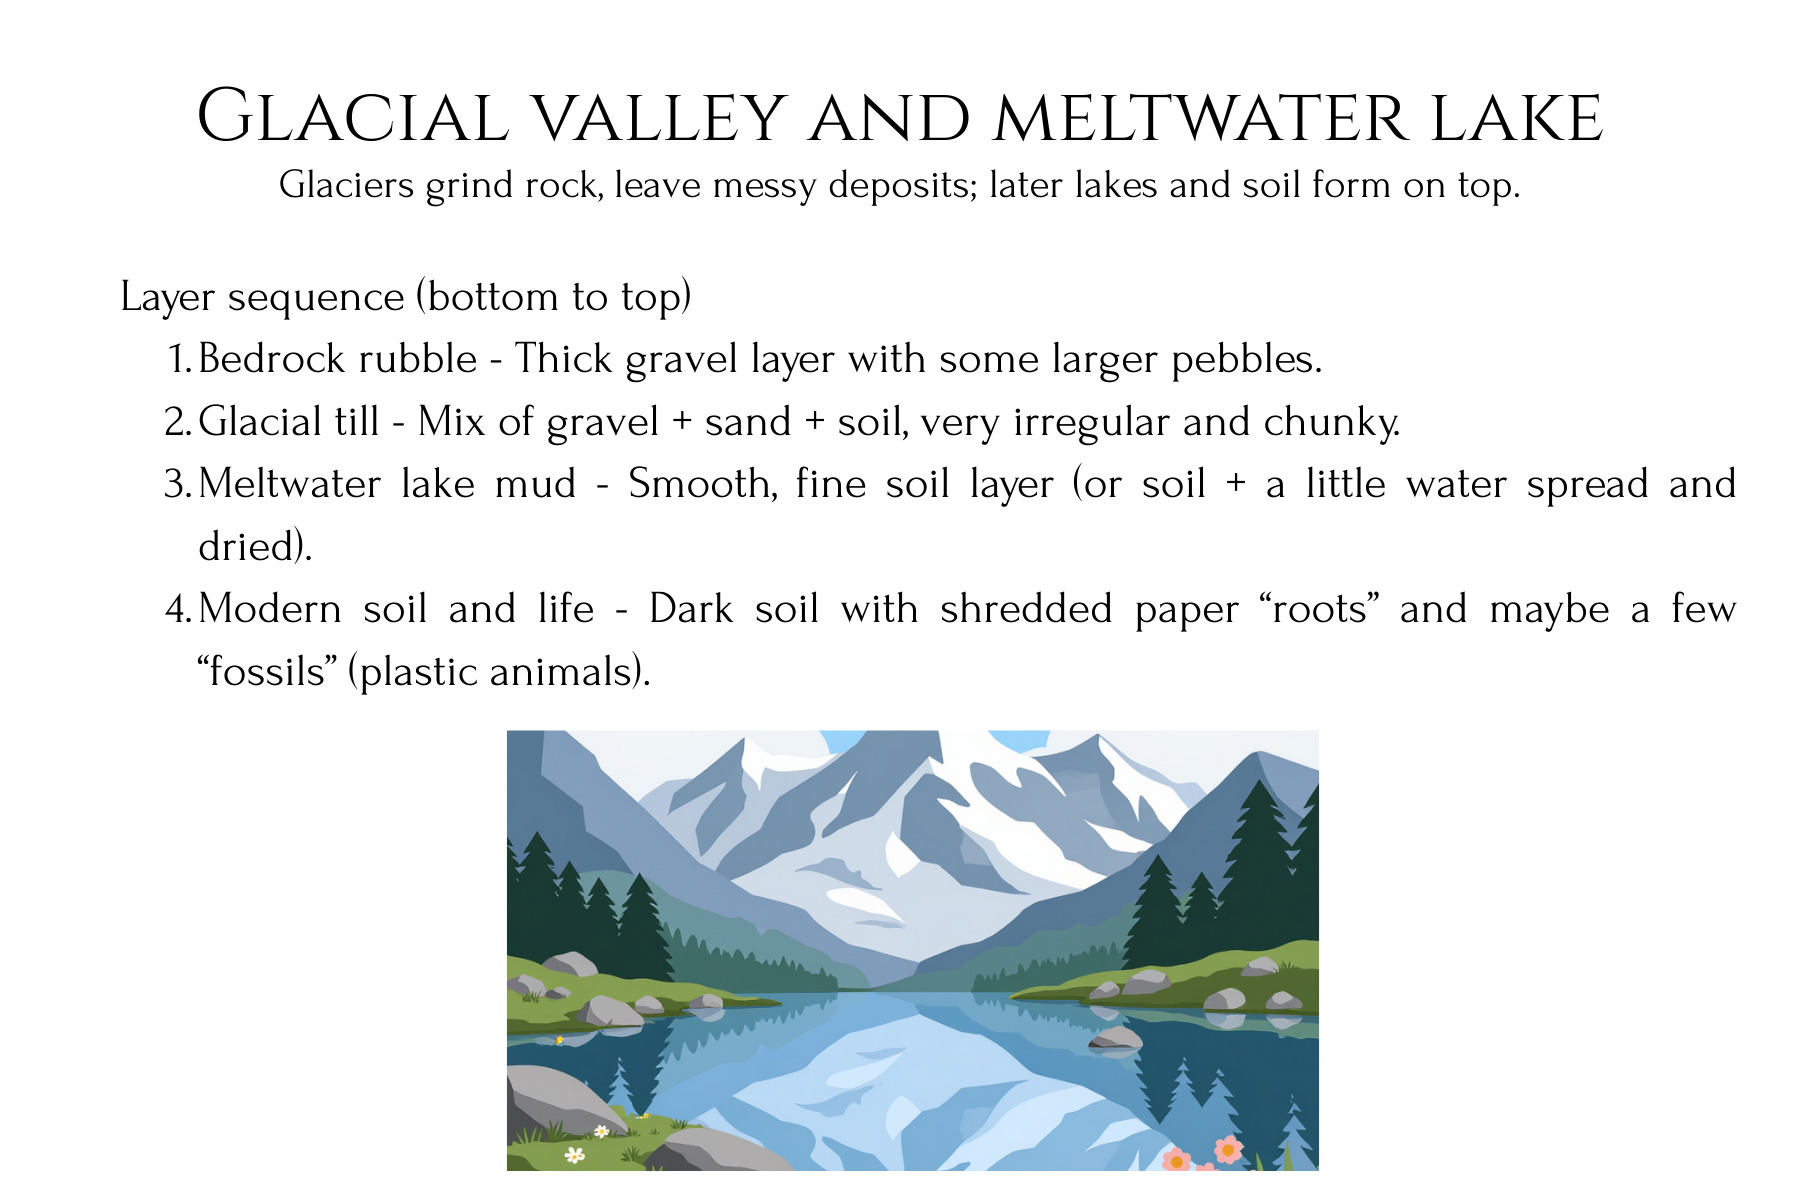
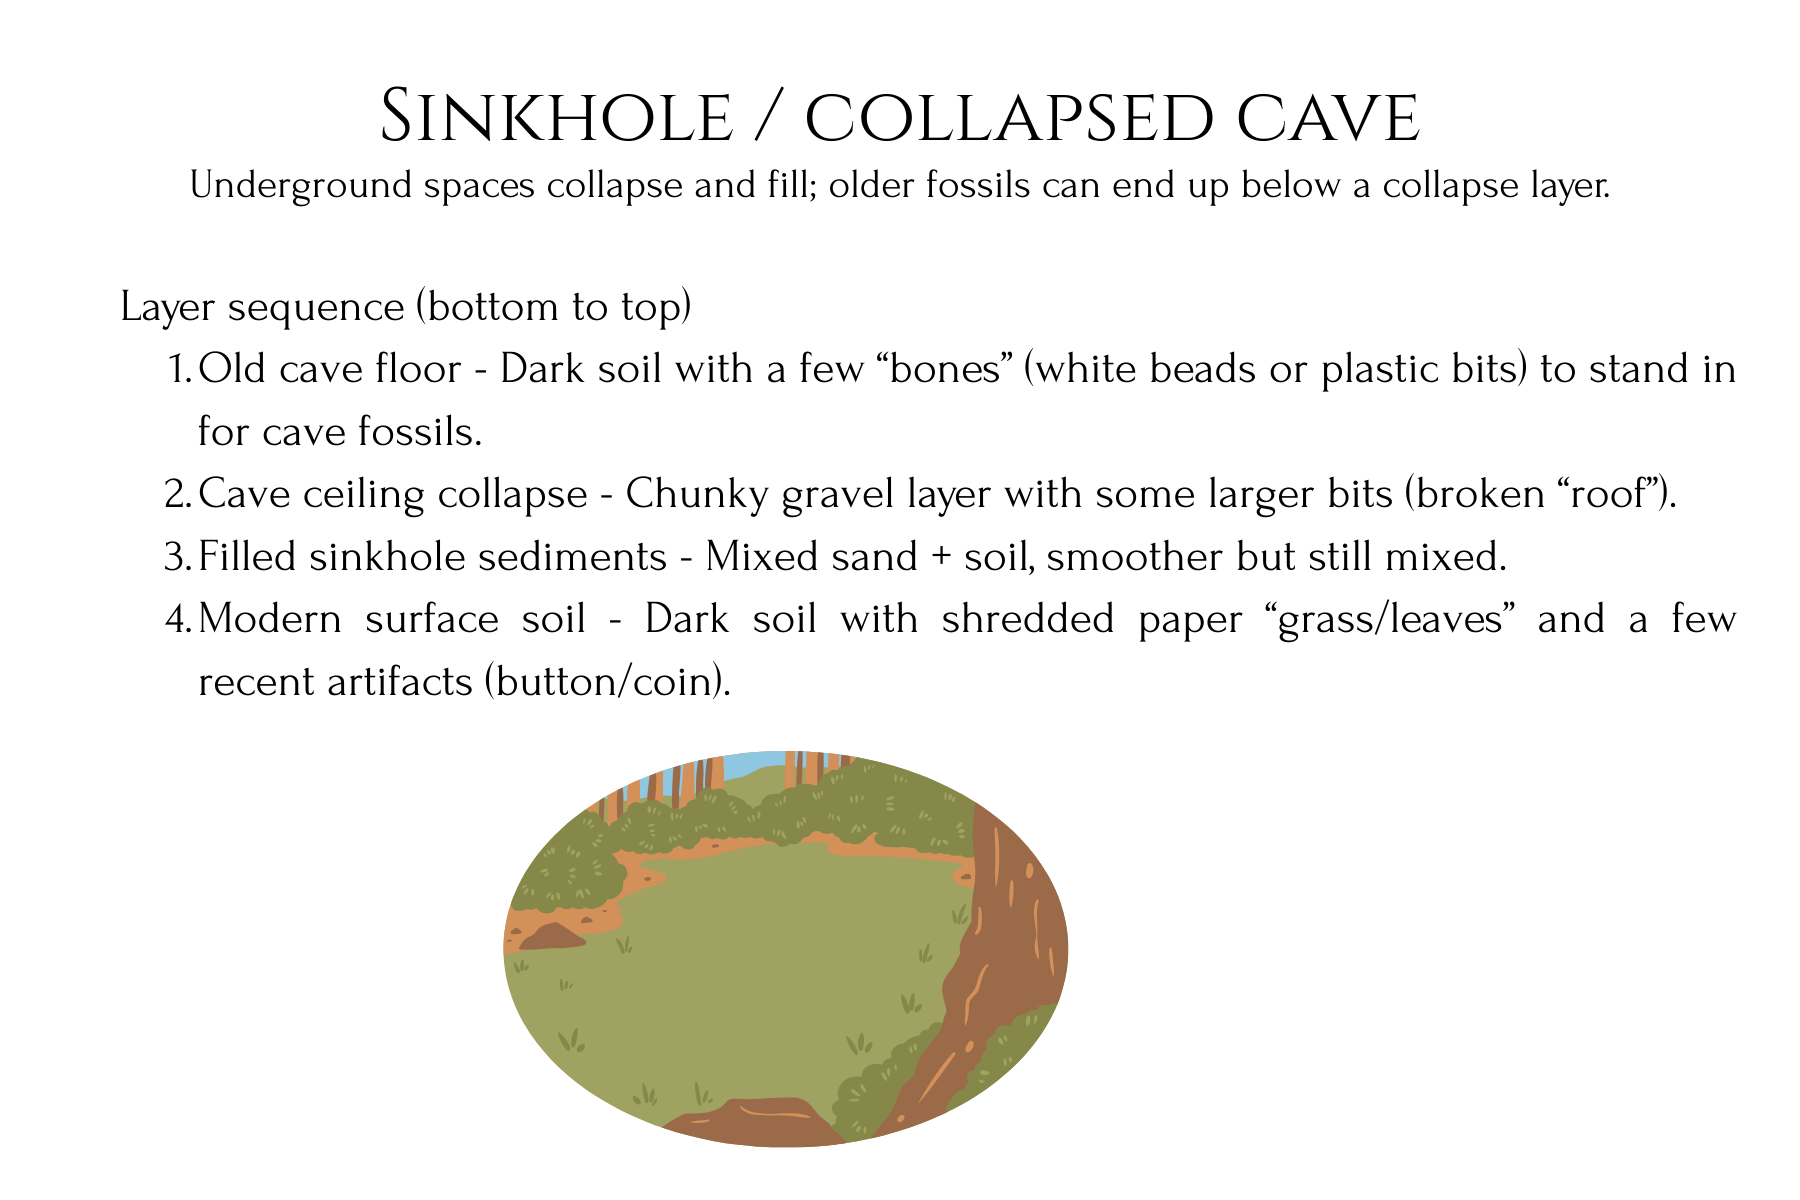
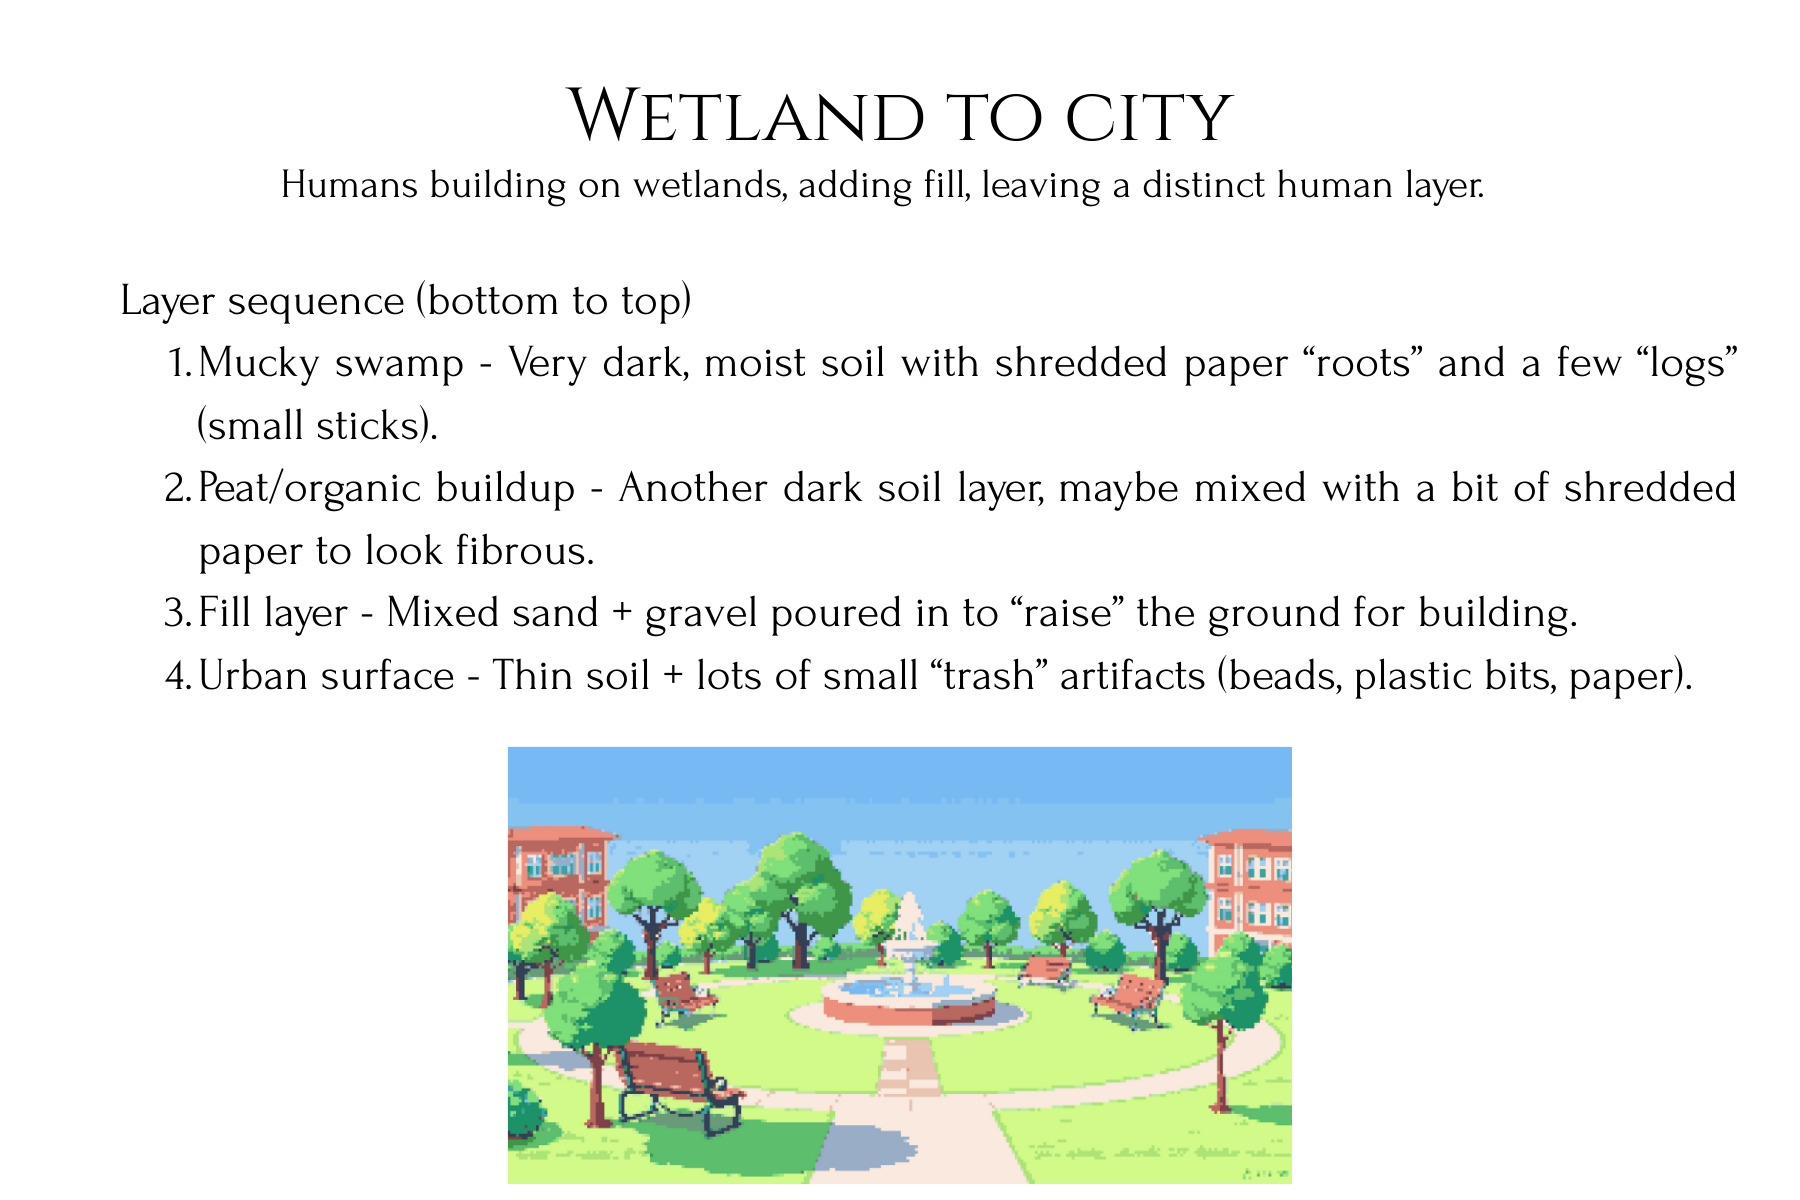
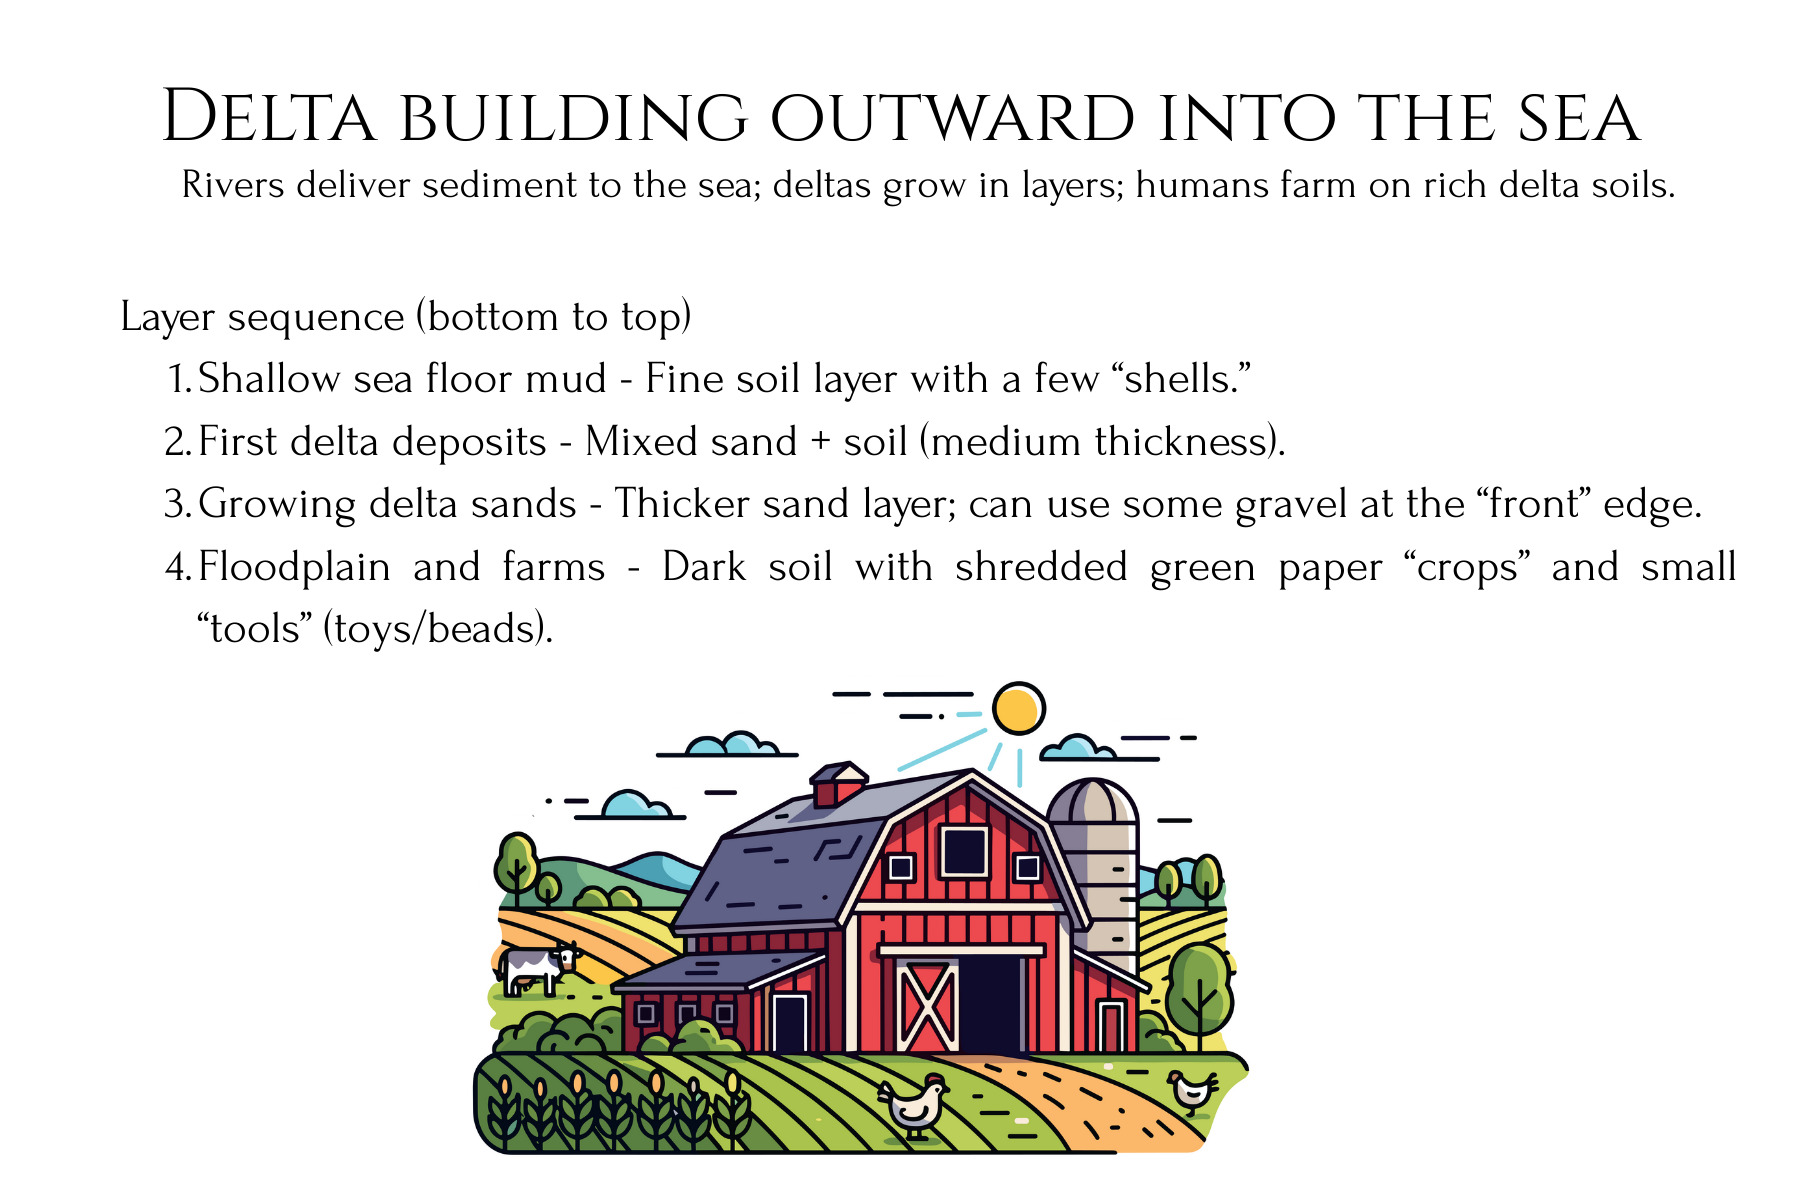
This stratigraphy lab unit turns abstract ideas about rock layers into a concrete, dig‑in experience for students. Learners first design and build a clear-bin “Earth history” model with layered sediments and artifacts, then trade and excavate to reconstruct the hidden story from the layers they uncover. Printable Landscape Story Cards, students can model real‑world environments like river floodplains, coastlines, glaciers, wetlands, deltas, deserts, and cities, then ‘read’ the layered record they create. In the second phase, they construct a playdough shield volcano, record successive lava flows on graph paper, and then cut a canyon and take core samples to reveal how eruptions and erosion reshape landforms over time.
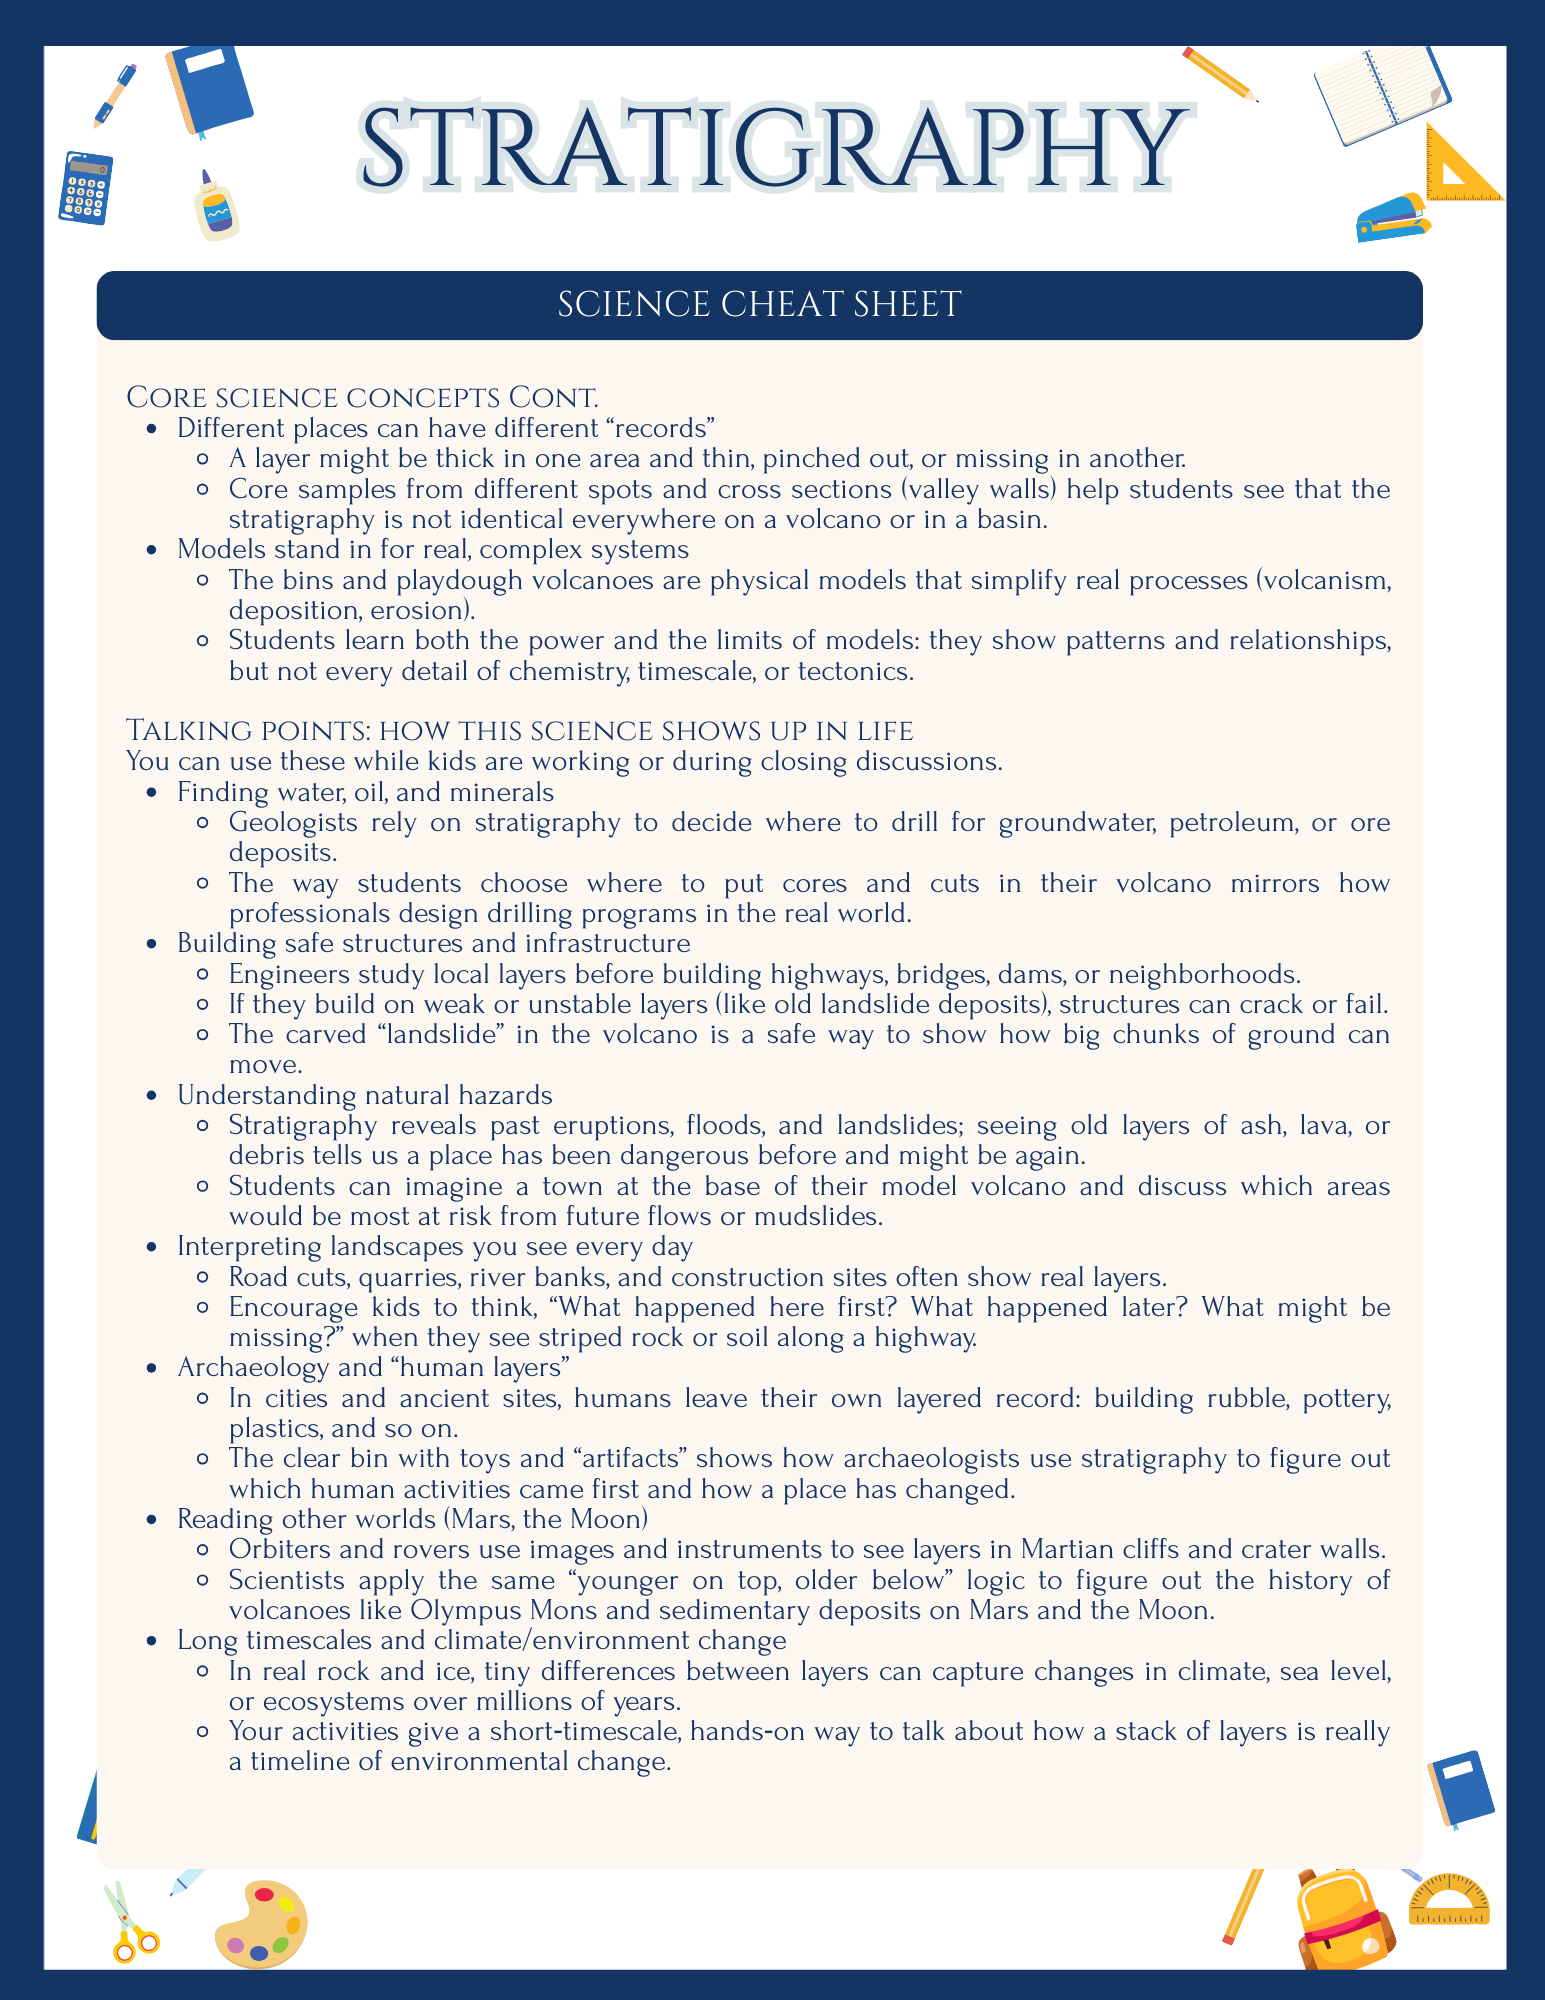
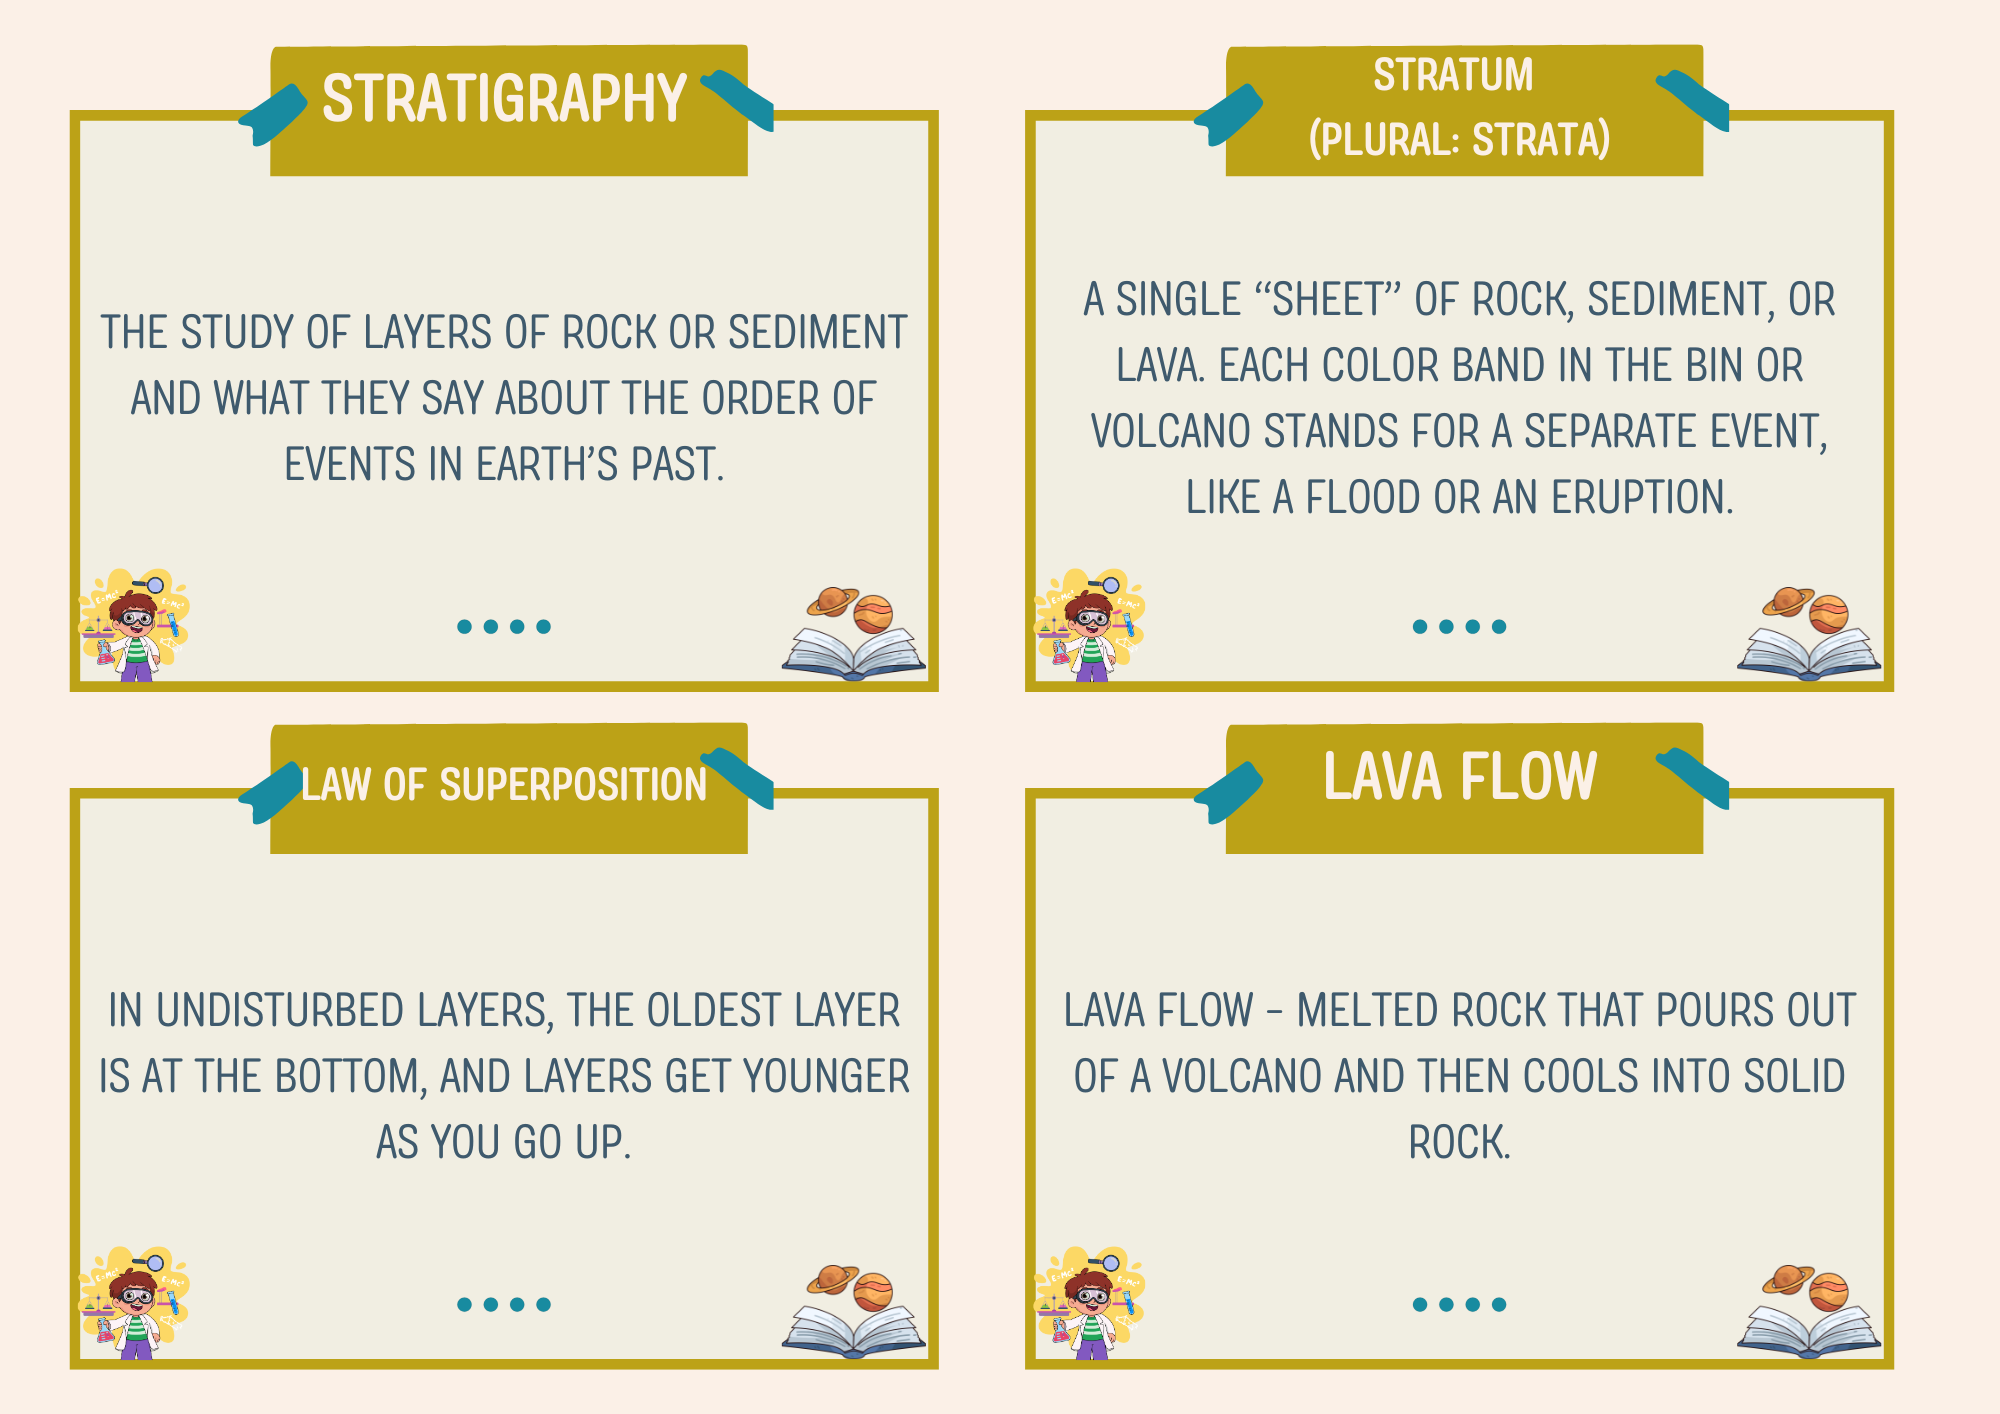
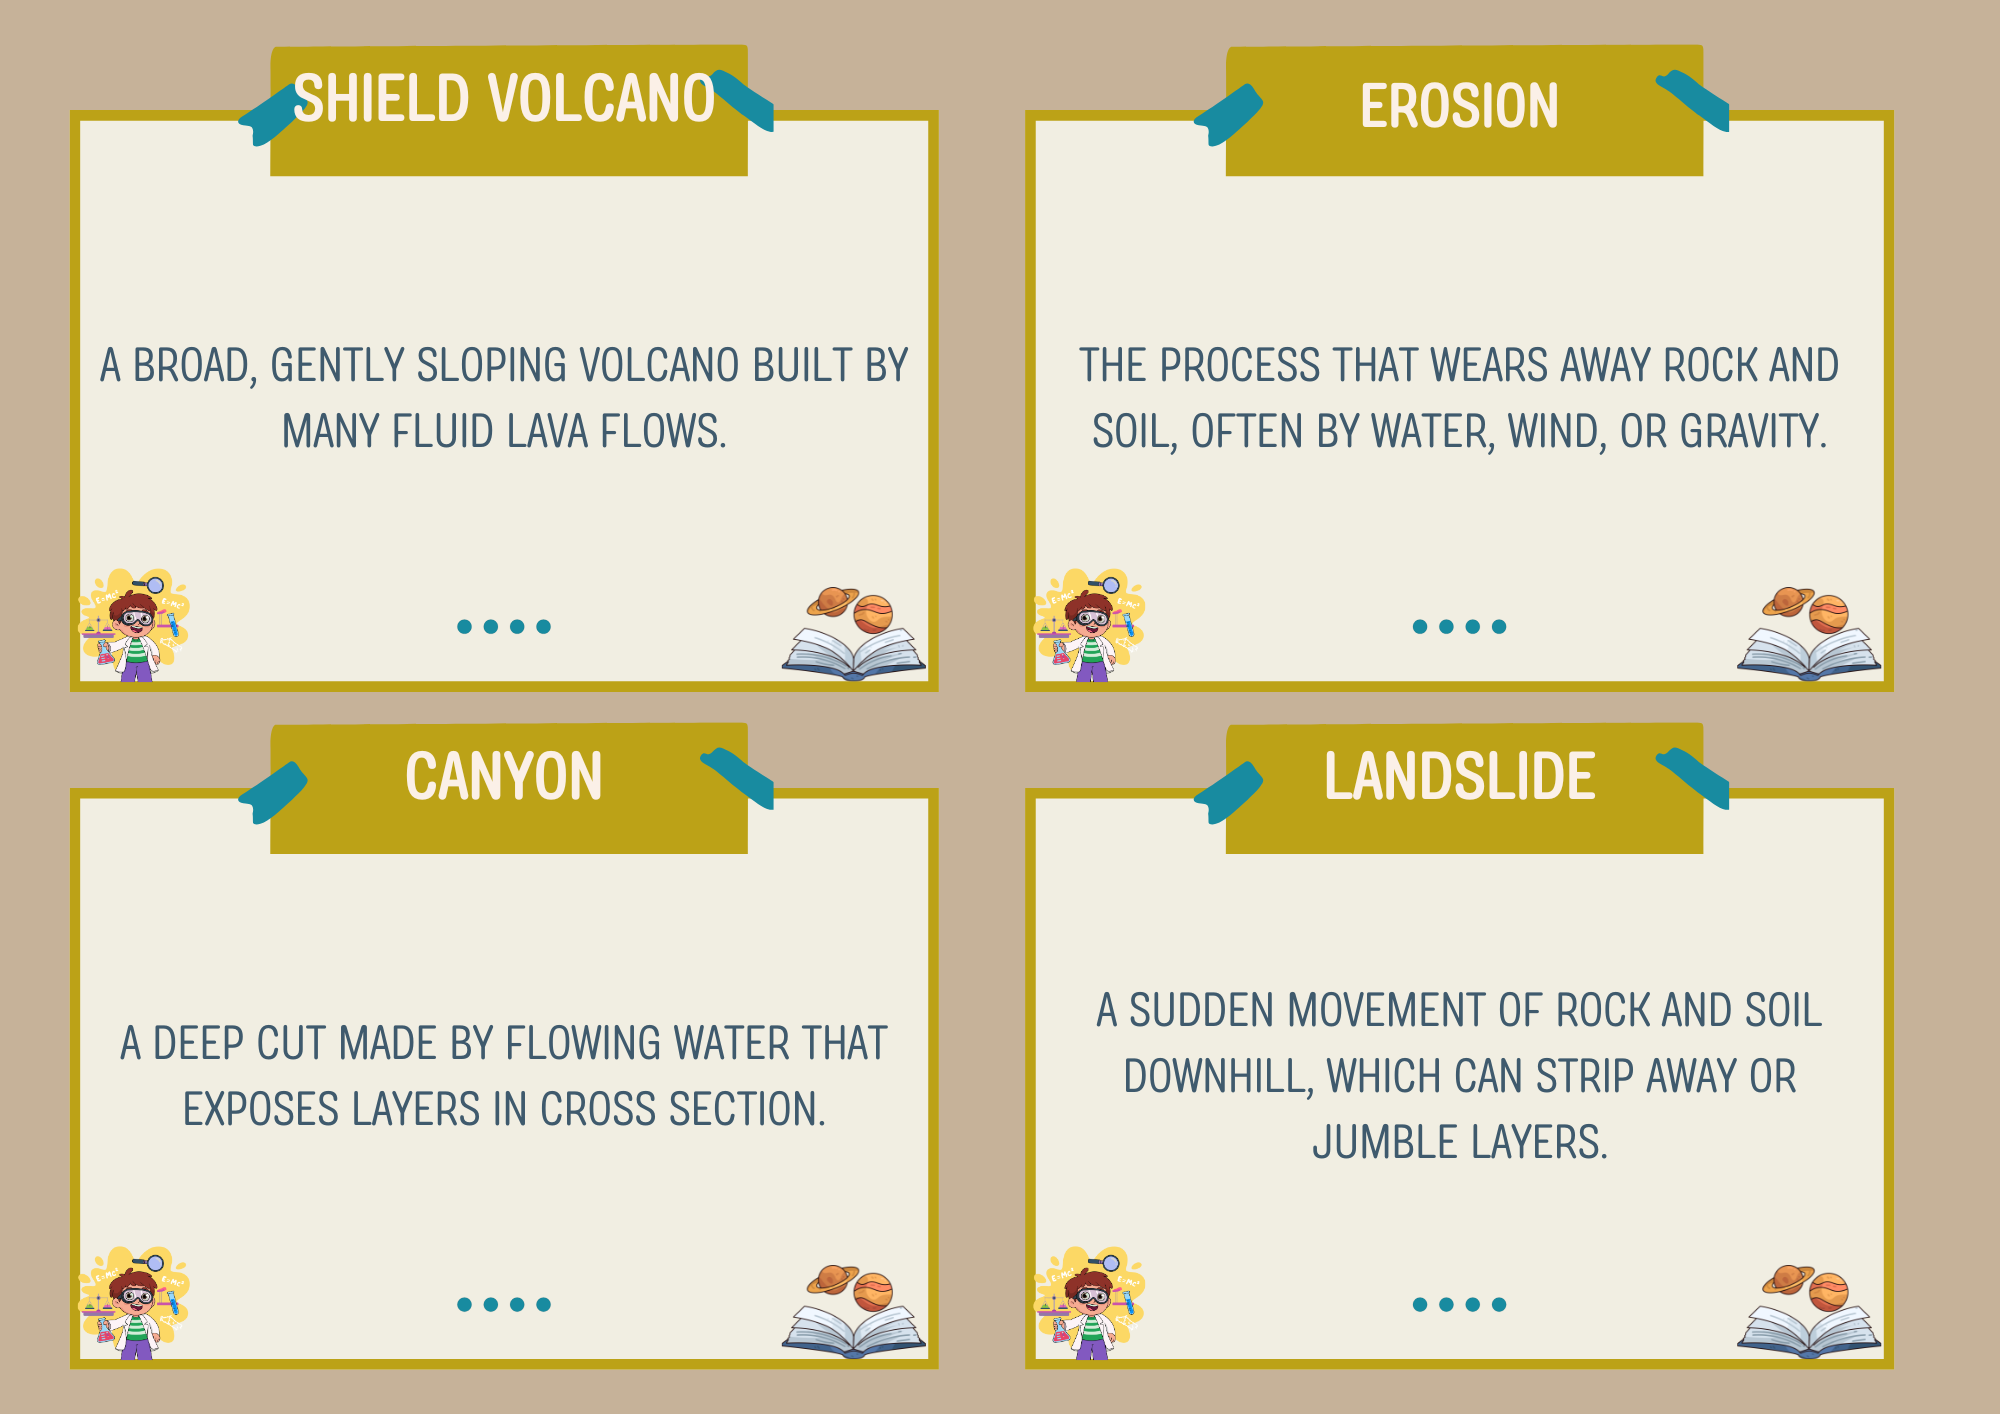
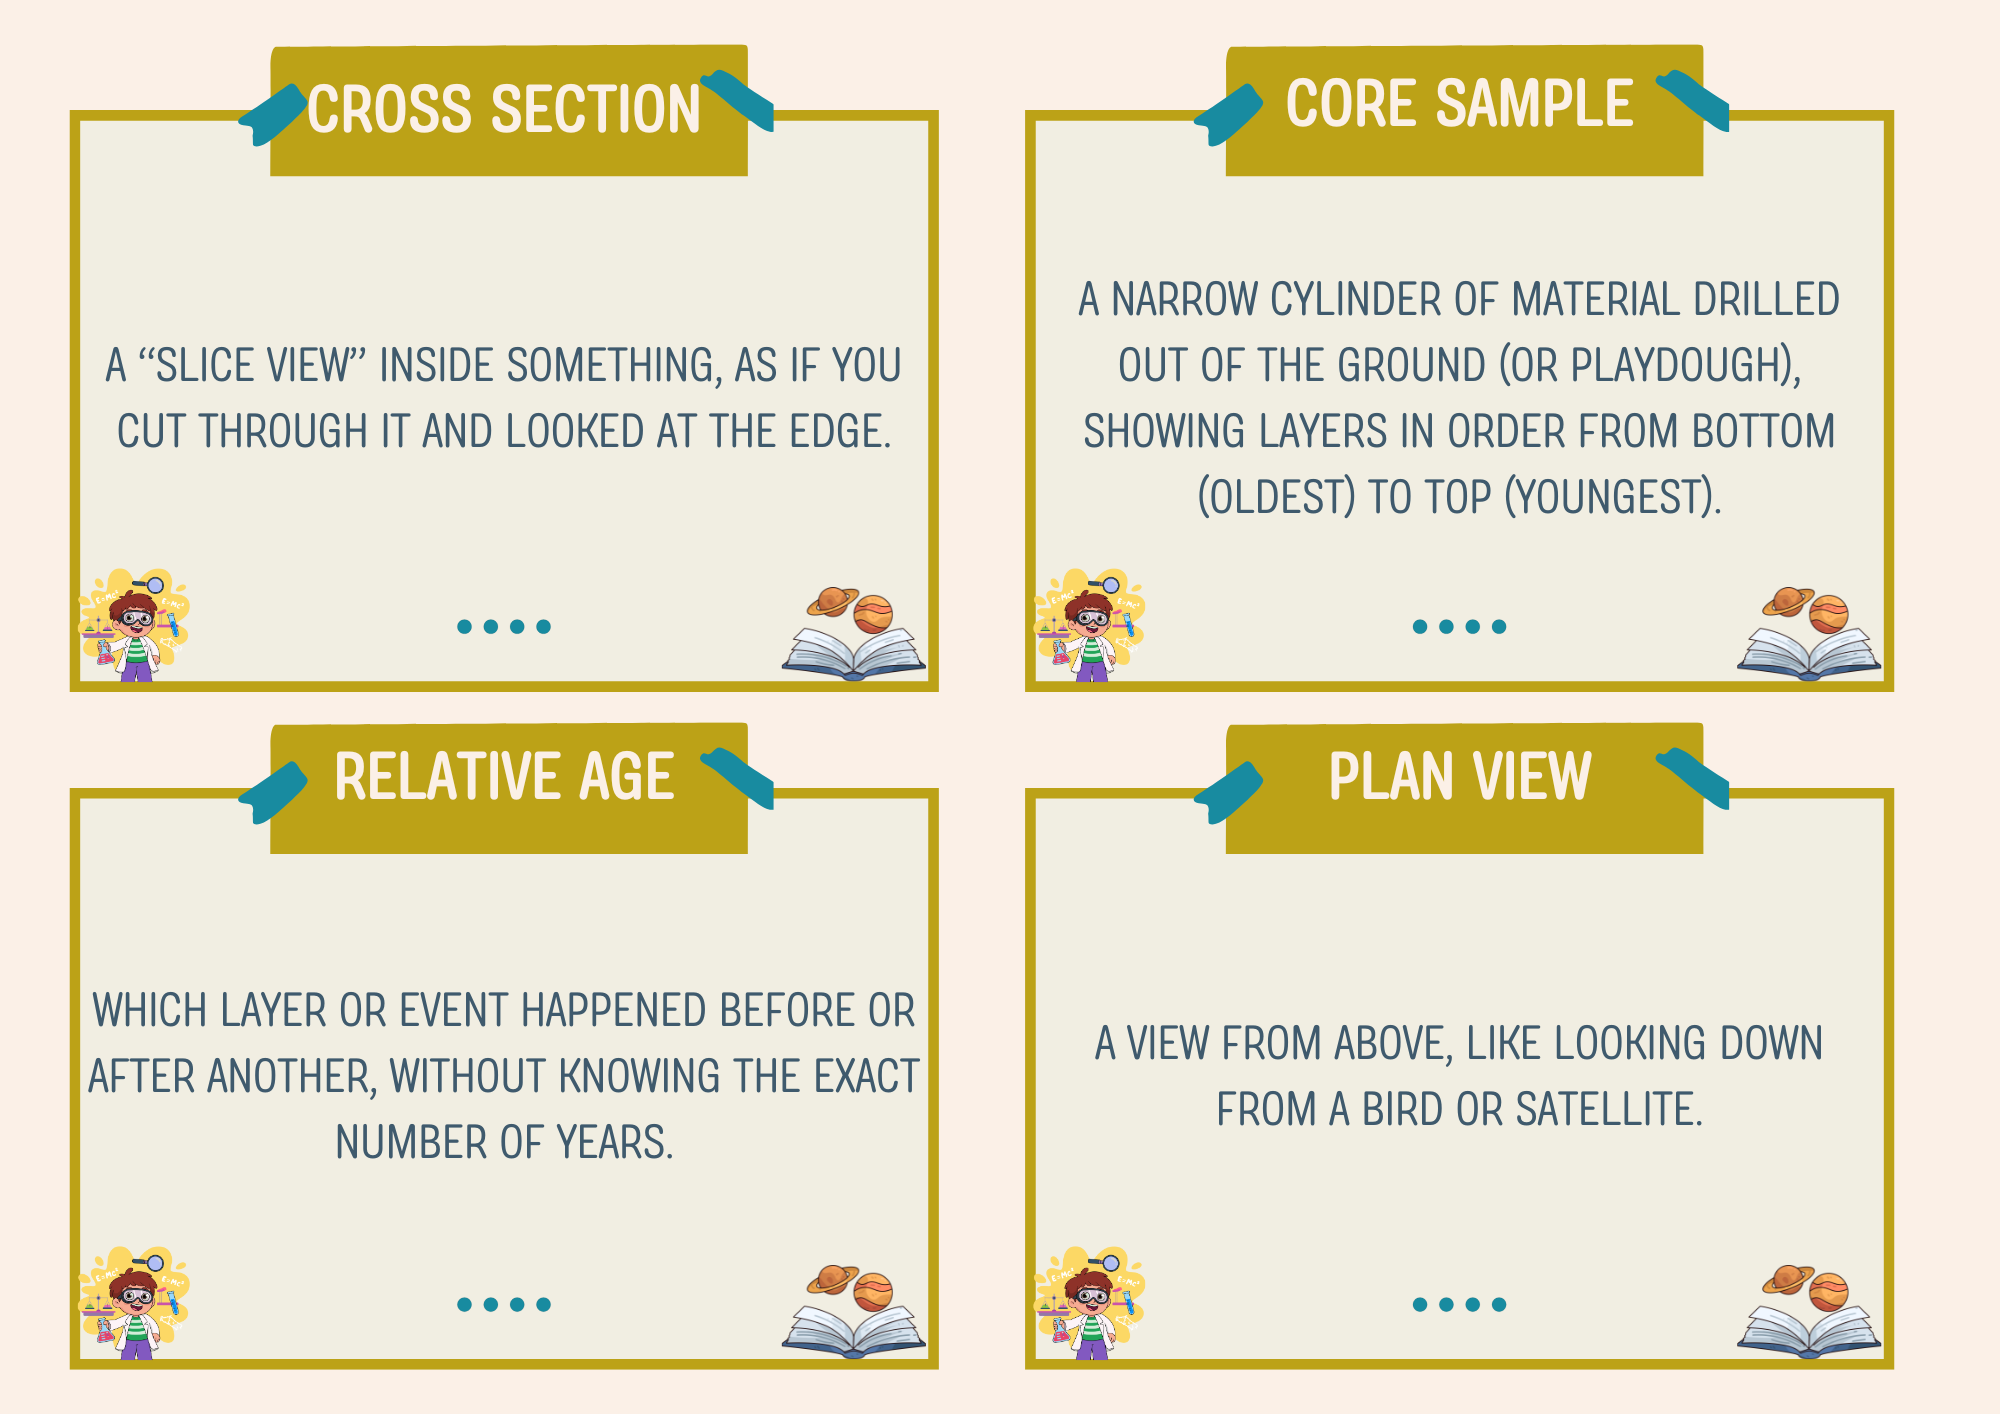
The included lesson plan walks you step‑by‑step through setup, timing, guiding questions, and debrief, with NGSS connections such as MS‑ESS1‑4, MS‑ESS2‑2, 4‑ESS1‑1, and 4‑ESS2‑2 clearly highlighted. Printable supports include lab recording pages, scaled and unscaled graph paper options, and vocabulary/reference cards covering key terms like stratigraphy, law of superposition, lava flow, erosion, cross section, and core sample. Students practice modeling, mapping, relative dating, and simple quantitative reasoning (e.g., counting squares for flow area), making this unit a strong fit for both middle school earth science and upper‑elementary extension work.
This resource is designed to be flexible for classroom, lab, or homeschool settings. Younger learners can focus on observing patterns and ordering events (older vs. younger layers), while older students can extend into Claim‑Evidence‑Reasoning writing, map‑to‑cross‑section interpretation, and optional math integrations around scale and area. The teacher “science cheat sheet” and closing prompts support confident instruction even for non‑specialists, and extension ideas connect the models to real road cuts, volcanoes on Earth and Mars, engineering, natural hazards, and archaeology.
Only logged in customers who have purchased this product may leave a review.

Reviews
There are no reviews yet.