
Geographic Information Systems, commonly known as GIS, is relatively a new field that incorporates an interdisciplinary approach to visualizing data. This field is, in a broad terms, an intersection between geosciences (such as geography and geology) and computer science (graphics, data, programming, statistics). The main purpose of GIS is to represent data in a layered map form. This enables scientists, politicians, businessmen, police, army, etc to visualize their data into a familiar look of a map, and by doing so better understanding of the data is achieved to make decisions more accurately and efficiently. This article discusses the applications of GIS and what goes into the inputs, processes, and outputs of GIS.
I graduated with a computer science, engineering, and technology degree in 2011. I finished a bachelor of science degree in geography, as my second degree, in 2015. My educational background does put me in a unique position in relation with GIS. Because not only do I hold degrees in both fields that make up GIS, I am also hold multiple certifications in data science. These degrees and certifications enables me to understand how GIS works better than most people who come by GIS through either geography or computer science.
Geographic Information Systems generally consist of three parts that make up the system. These subsystems are what is expected from any computerized system;
- An input system for data collection and analysis
- Hardware and software to process, manipulate, manage, and display the data
- An output system to generate maps and images
Data collection is done differently for each project. But generally satellite images are used for the base layer of the map. This is called remote sensing and it is a field of study on its own. Other layers of data are either acquired first-hand or second-hand. First hand data collections involves field work and surveying an area to collect data of interest to the project on hand. Second-hand data is the most used form of data in GIS, such data could be government census.
Hardware and software are needed to process and layer our data in any certain project, since GIS is a computerized system. Any personal computer can be used as a GIS hardware with the correct software. There exist multiple open-source GIS software out there, such as OSGeo and QGIS. However, most universities and industries use a proprietary software called Esri ArcGIS.
The output system is used to display the final project. This can be a printer for a hard copy of the map or a computer screen. Nowadays, mobile phones are the most common output system for GIS, thanks to Google Maps.
GIS is an interesting and fun field that incorporates a lot. Given the nature of geography and computer graphic there is a lot of room for art to be incorporated into the process. I have worked on a school project in GIS a couple of years ago. The project was simple: Take city populations data of Newfoundland from Statistics Canada website then display them on a physical Newfoundland map. What I did in this project was to make my own map of Newfoundland using techniques similar to the ones used by Mohammed Al-Idrisi, a 12th century cartographer from Sicily. You can see a comparison between the map I created and the map provided by Newfoundland government’s website.
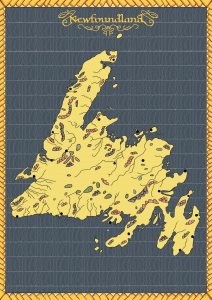
The reason I used an ancient map making technique rather than a standard map was to demonstrate that art is an important part of GIS and cartography. I wanted to demonstrate the use of art, science, and technology in GIS. I used science in the form of statistics of city populations and their locations. I used technology in the form of a computer and GIS software to make and display the map. And I used art in the form of cartography techniques to produce the look and feel of an ancient map. I enjoyed working on this school project a lot as it was a great demonstration of the interdisciplinary nature of GIS.
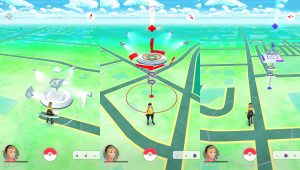
Most people use Google Maps on their phones. That is by the far the most widely used GIS application today. Google Maps is designed to be intuitive to users and easy to understand, as it has the look and feel of a street map. It also serves as the backbone of different art projects, such as video games https://genericforgreece.com. For example, Ingress and Pokemon Go use Google Maps data as their input, process the map data from Google to add layers and change the feel and look of it, then sends the processed maps to users’ phones.
The GIS examples I provided in this article are some of the fun ways GIS is being used today. However, GIS is being used is so much more “serious” applications. Police and ambulances use their own applications of GIS to determine the shortest and most efficient route to respond and reach where they are needed. Natural resources, such as oil and gas, businesses use GIS applications to determine where are the likely locations to dig for oil. Scientist, climatologist, and meteorologist use it to study the climate and report the weather.
GIS is one of the most interesting and lucrative fields today. The applications of this field are endless and versatile. Whatever is your field of study, let it be biology, chemistry, medicine, business, or sociology. GIS is a great tool to use to visualize your data and communicate your findings in an effective, efficient, and fun way.